"How is the Market?"
This is the most common question we get asked as Realtors. At the risk of sounding evasive, the best answer is to say "Why do you ask?".
The point is that we need more information before we can answer the question appropriately. Is the person asking about his/her neighborhood, city, zip code or metro area? From what perspective - homeowner (seller's)/buyer's/investor's or renter?
Our market (Charleston Metro Area) is still strong (seller's market). However momentum is shifting and many sub-areas are behaving differently. For example, while the median Months of Supply for the whole Charleston MLS (single family detached homes) is pretty stable at 3.9 months, some of the sub-markets are behaving quite differently. The following chart shows how the months of supply can vary for areas such as Downtown Charleston, Isle of Palms and Hanahan, compared to the whole metro area.
Why are we saying that the market is "still strong" but shifting to a "softer market"? A couple of statistics show us this trend in numbers. The first one is Percent of Original List Price, which shows how "negotiable" sellers are by area. As you can see, most areas are consistently getting lower percentage of the original list price. Active and experienced Realtors who work in the market day in and day out can "feel" the change happening. The symptoms are evident: Price adjustments are becoming more common, offers are coming in at slightly lower percentage of list price, and buyers have slightly more power negotiating repairs and concessions.
The second one is the Days on Market. Although the Charleston market is still under-supplied (overall), the Median Days on Market for the Metro Area has increased, especially in high-priced areas. However, in lower priced areas like Hanahan and Summerville, homes are selling even faster now than last year. This is a symptom of a "shifting market".
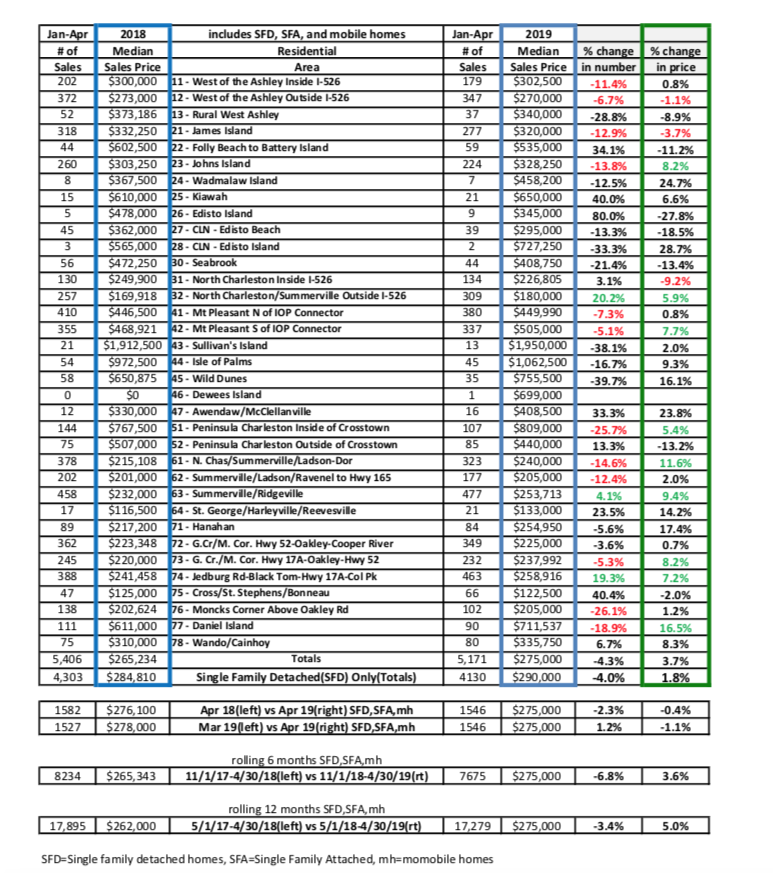
Many people rely on Zillow, Redfin or Realtor.com to get information on market trends. Although these "mega websites" are useful in identifying trends, they are not "hyper-local" enough to inform about the state you a particular sub-area of the market. The following table shows the YTD area strength compared to last year for the different MLS Areas (click image to enlarge). This shows how differently one sub-area may behave compared to another sub-area within the same city. 
Click HERE if you wish to receive a Free Hyper-Local Report on your neighborhood.


Please contact us if you have any questions or comments.