In real estate we take it for granted that demand and supply drive home prices up or down. However, recent market behavior in some markets in the U.S. are defying this assumption!
The following is an excerpt from a blog post by CalculatedRisk.com which shows that the last few months home prices fell in some markets DESPITE their low inventory level compared to their level of demand (the Months of Inventory Index measures the relationship between demand and supply. We consider a 6 months supply a "balanced or neutral" market. Below 5 months it is a "sellers' market" (undersupplied) and above 7 months a "buyers' market" (oversupplied).
----
House Prices and Inventory
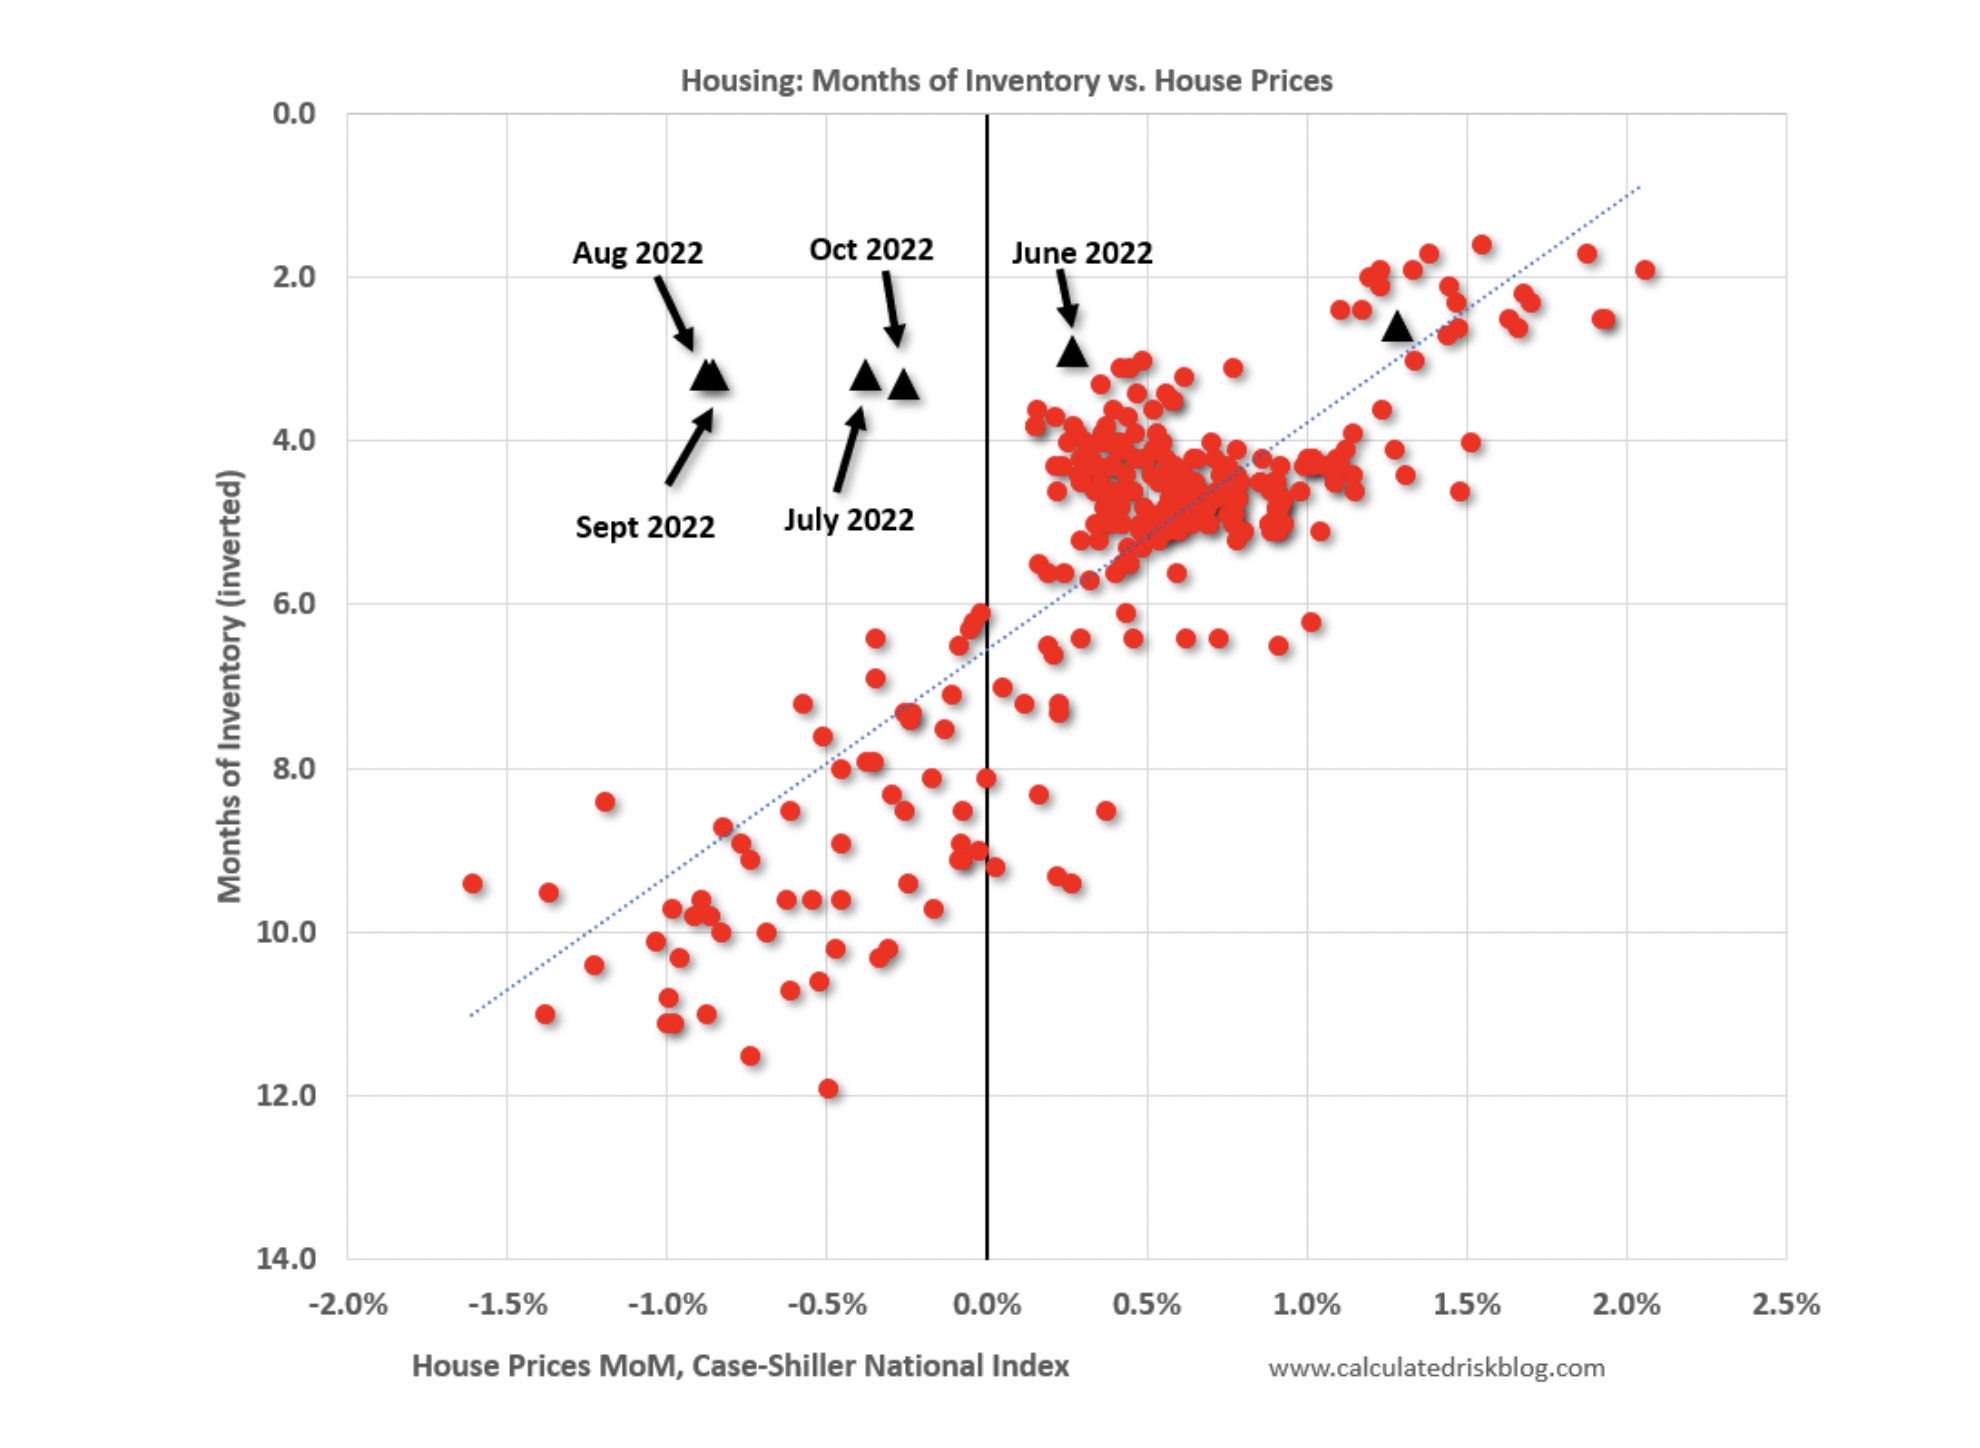
This graph below shows existing home months-of-supply (inverted, from the NAR) vs. the seasonally adjusted month-to-month price change in the Case-Shiller National Index (both since January 1999 through October 2022). Note that the months-of-supply is not seasonally adjusted.
The last six months are in black showing a possible shift in the relationship, and prices are now falling with somewhat low levels of inventory!

In October, the months-of-supply was at 3.2 months, and the Case-Shiller National Index (SA) decreased -0.26% month-over-month. The last four months appear to be outliers with prices falling even though months-of-supply is still somewhat low. Historically prices haven’t declined until inventory reached 6 months of supply. NOTE that the NAR appears to include some pending sales in their inventory, and inventory is probably up more than the NAR is reporting.
In the November existing home sales report, the NAR reported months-of-supply was unchanged at 3.3 months
----
The next six months will tell if these are "outliers" or indeed the market is starting to behave differently!
If you are interested in following our LOCAL real estate market in Charleston, SC, please subscribe to our monthly newsletter!
If you have any questions about buying or selling a home, please call or text us on 843-900-0155.


