So, how's the market?
This is the question that every Realtor gets every time. There are so many nuances to talk about that it is virtually impossible to condense everything into a 2-minute conversation.
This report goes from the general to the specific:
We will look at the US economic outlook, the mortgage rates, national home prices and rental rates and home affordability, then we're going to look at the Charleston SC market sales activity, home prices, supply and demand, a few sub-markets, market trends and the prognosis for 2020.
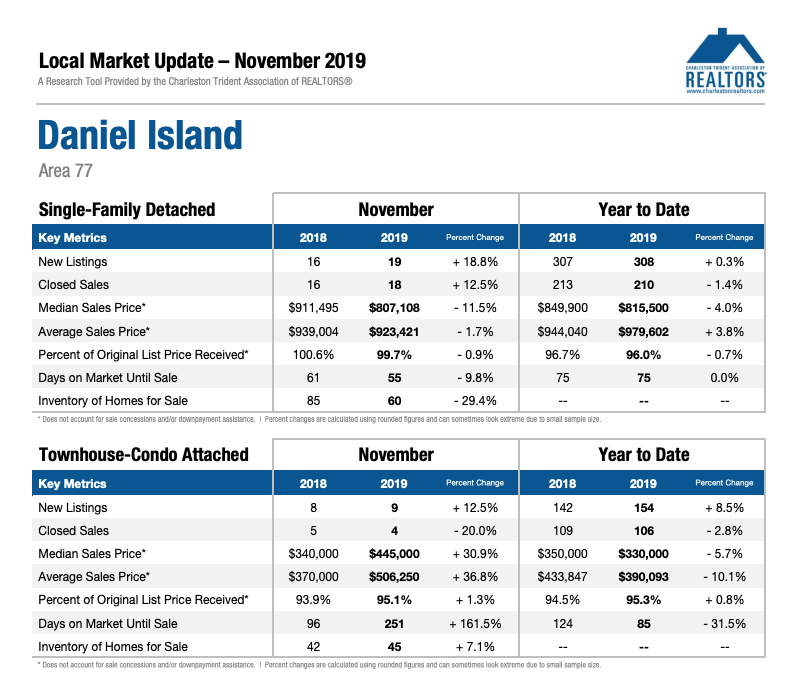
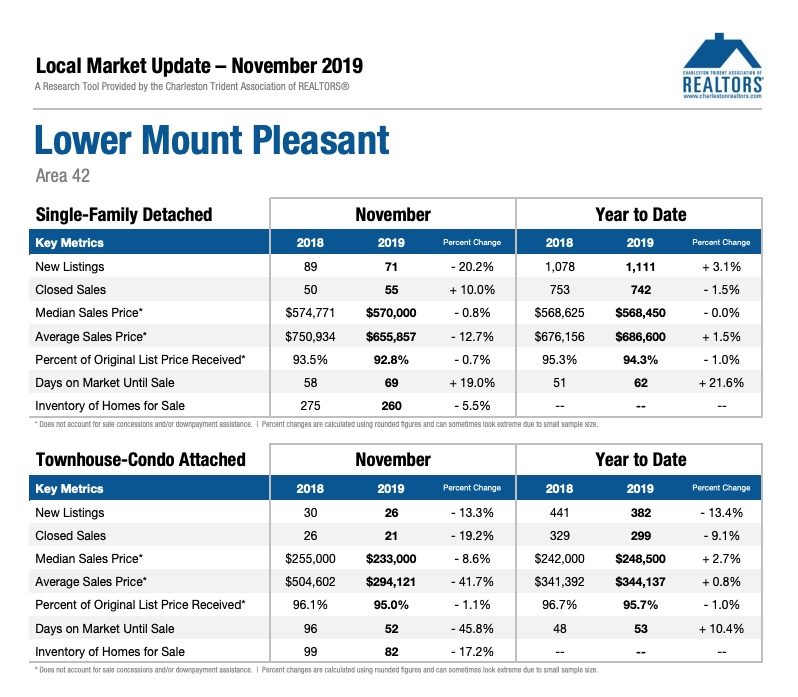
[IMPORTANT NOTE: At the very bottom of this blog, you will see specific market reports for MLS Areas such as Daniel Island and Lower Mount Pleasant. There are just too many to publish them all, so if you are interested in a particular MLS area, please request it by email to [email protected] and I will gladly send it to you!]
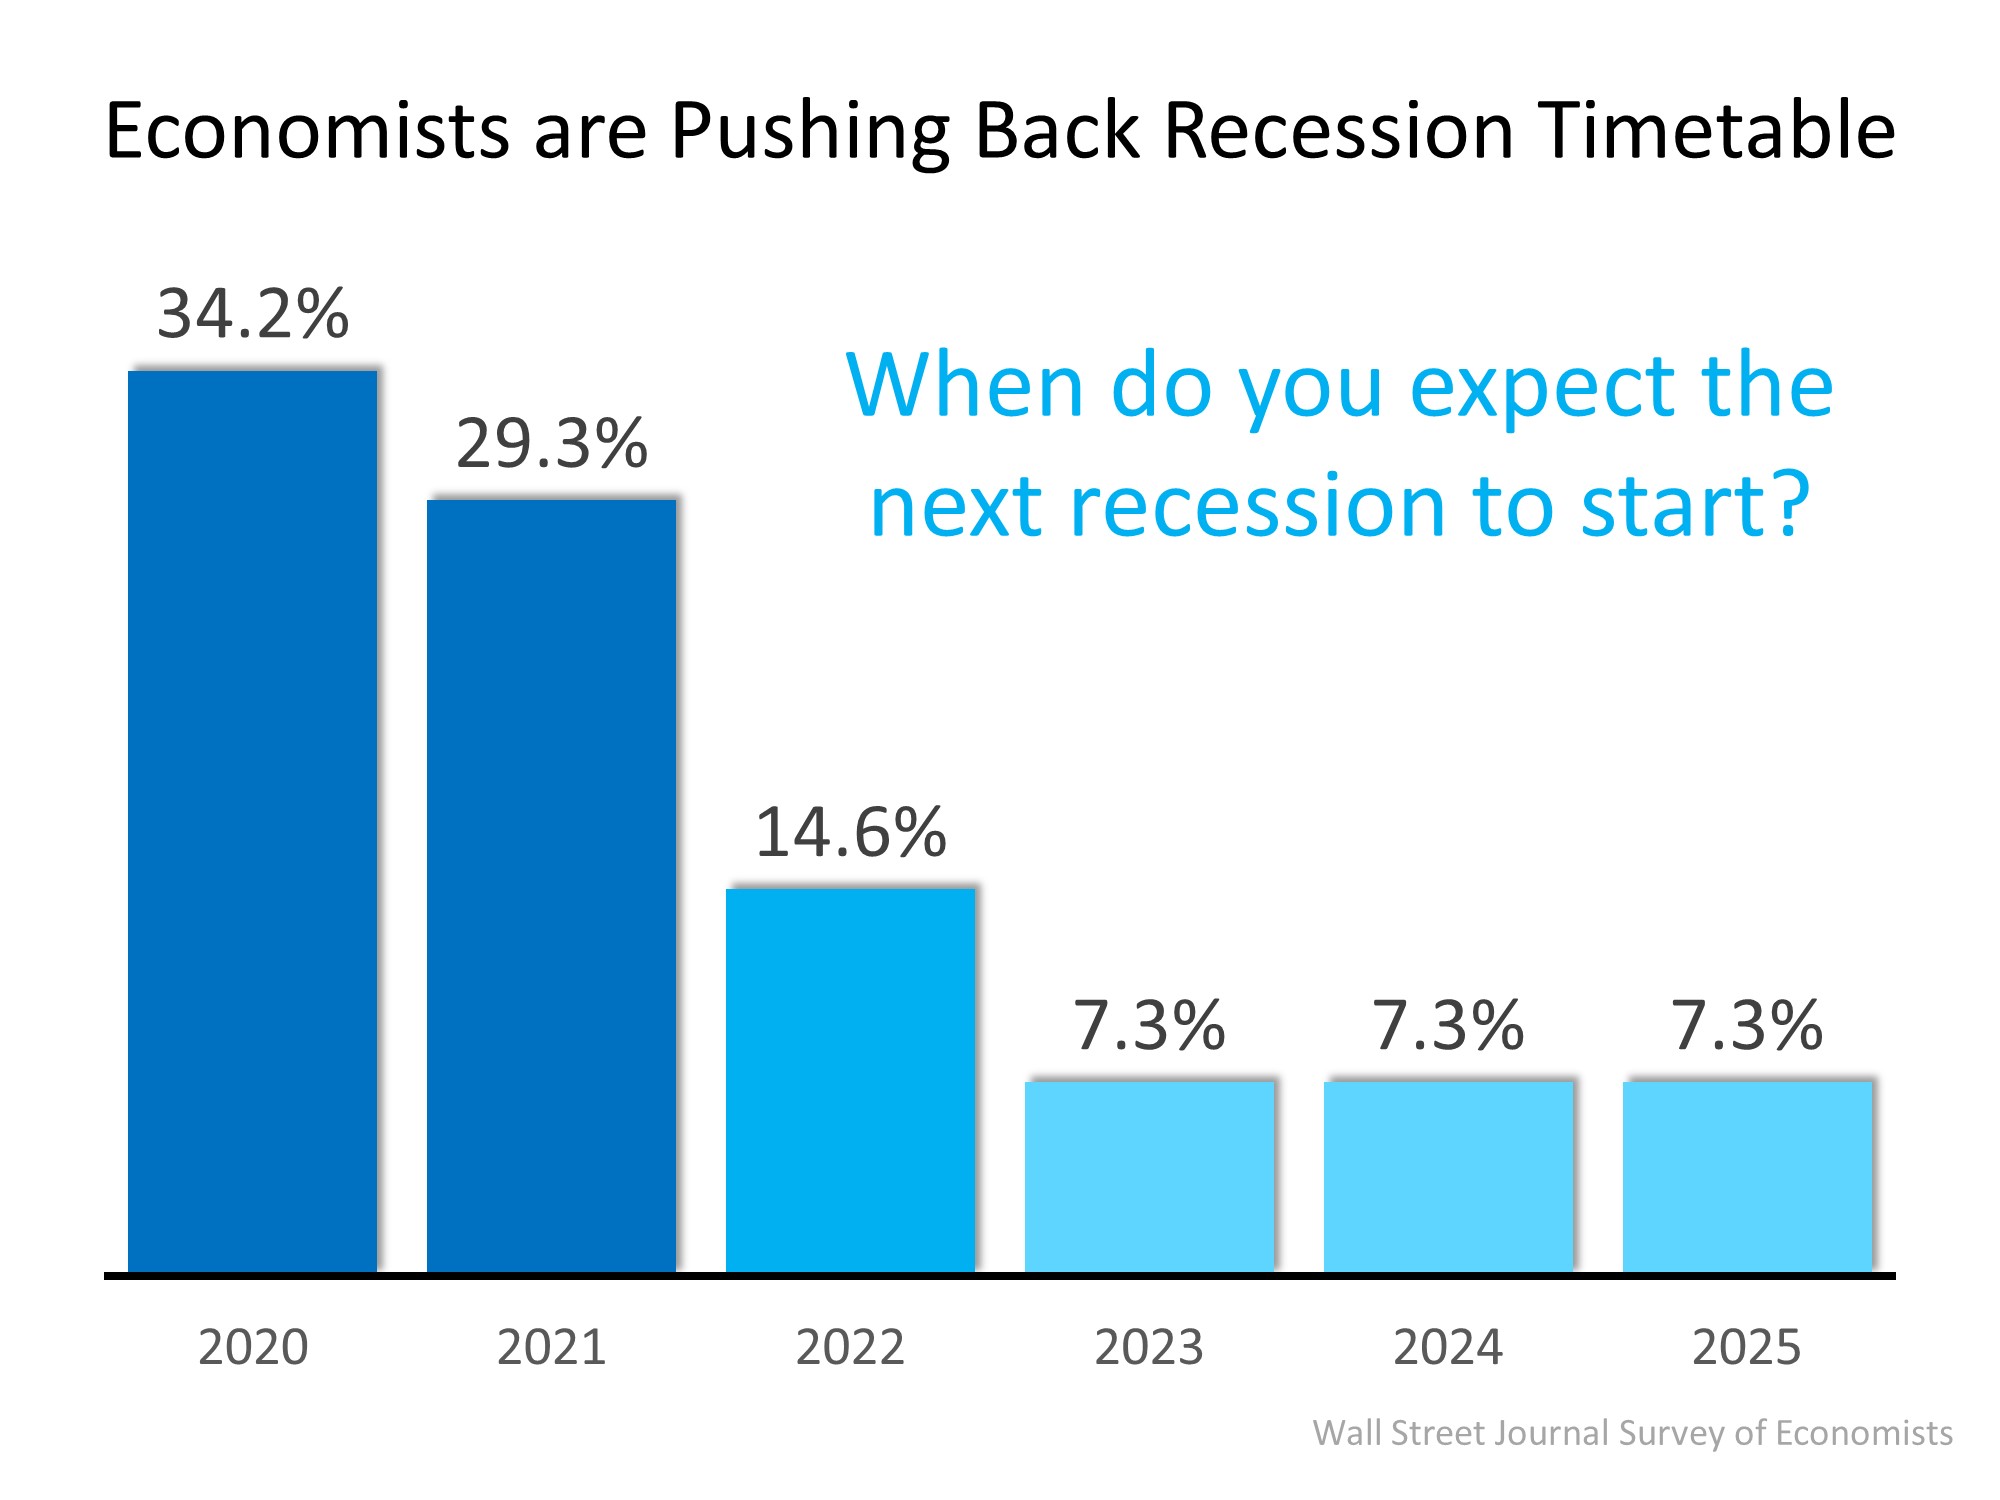
Let's talk about the economy in the US. This Wall Street Journal Survey shows that most economists believe that the economic slowdown (sometimes referred to as the recession) will not happen as fast as previously thought. Most of them are predicting the slowdown to start at the end of 2020 or the beginning of 2021. In addition, most experts agree that the expected recession will be a mild one, nothing like the meltdown we saw in 2008. Relating this to real estate prices, it is important to note that during 3 of the last 5 recessions, home prices actually went up!
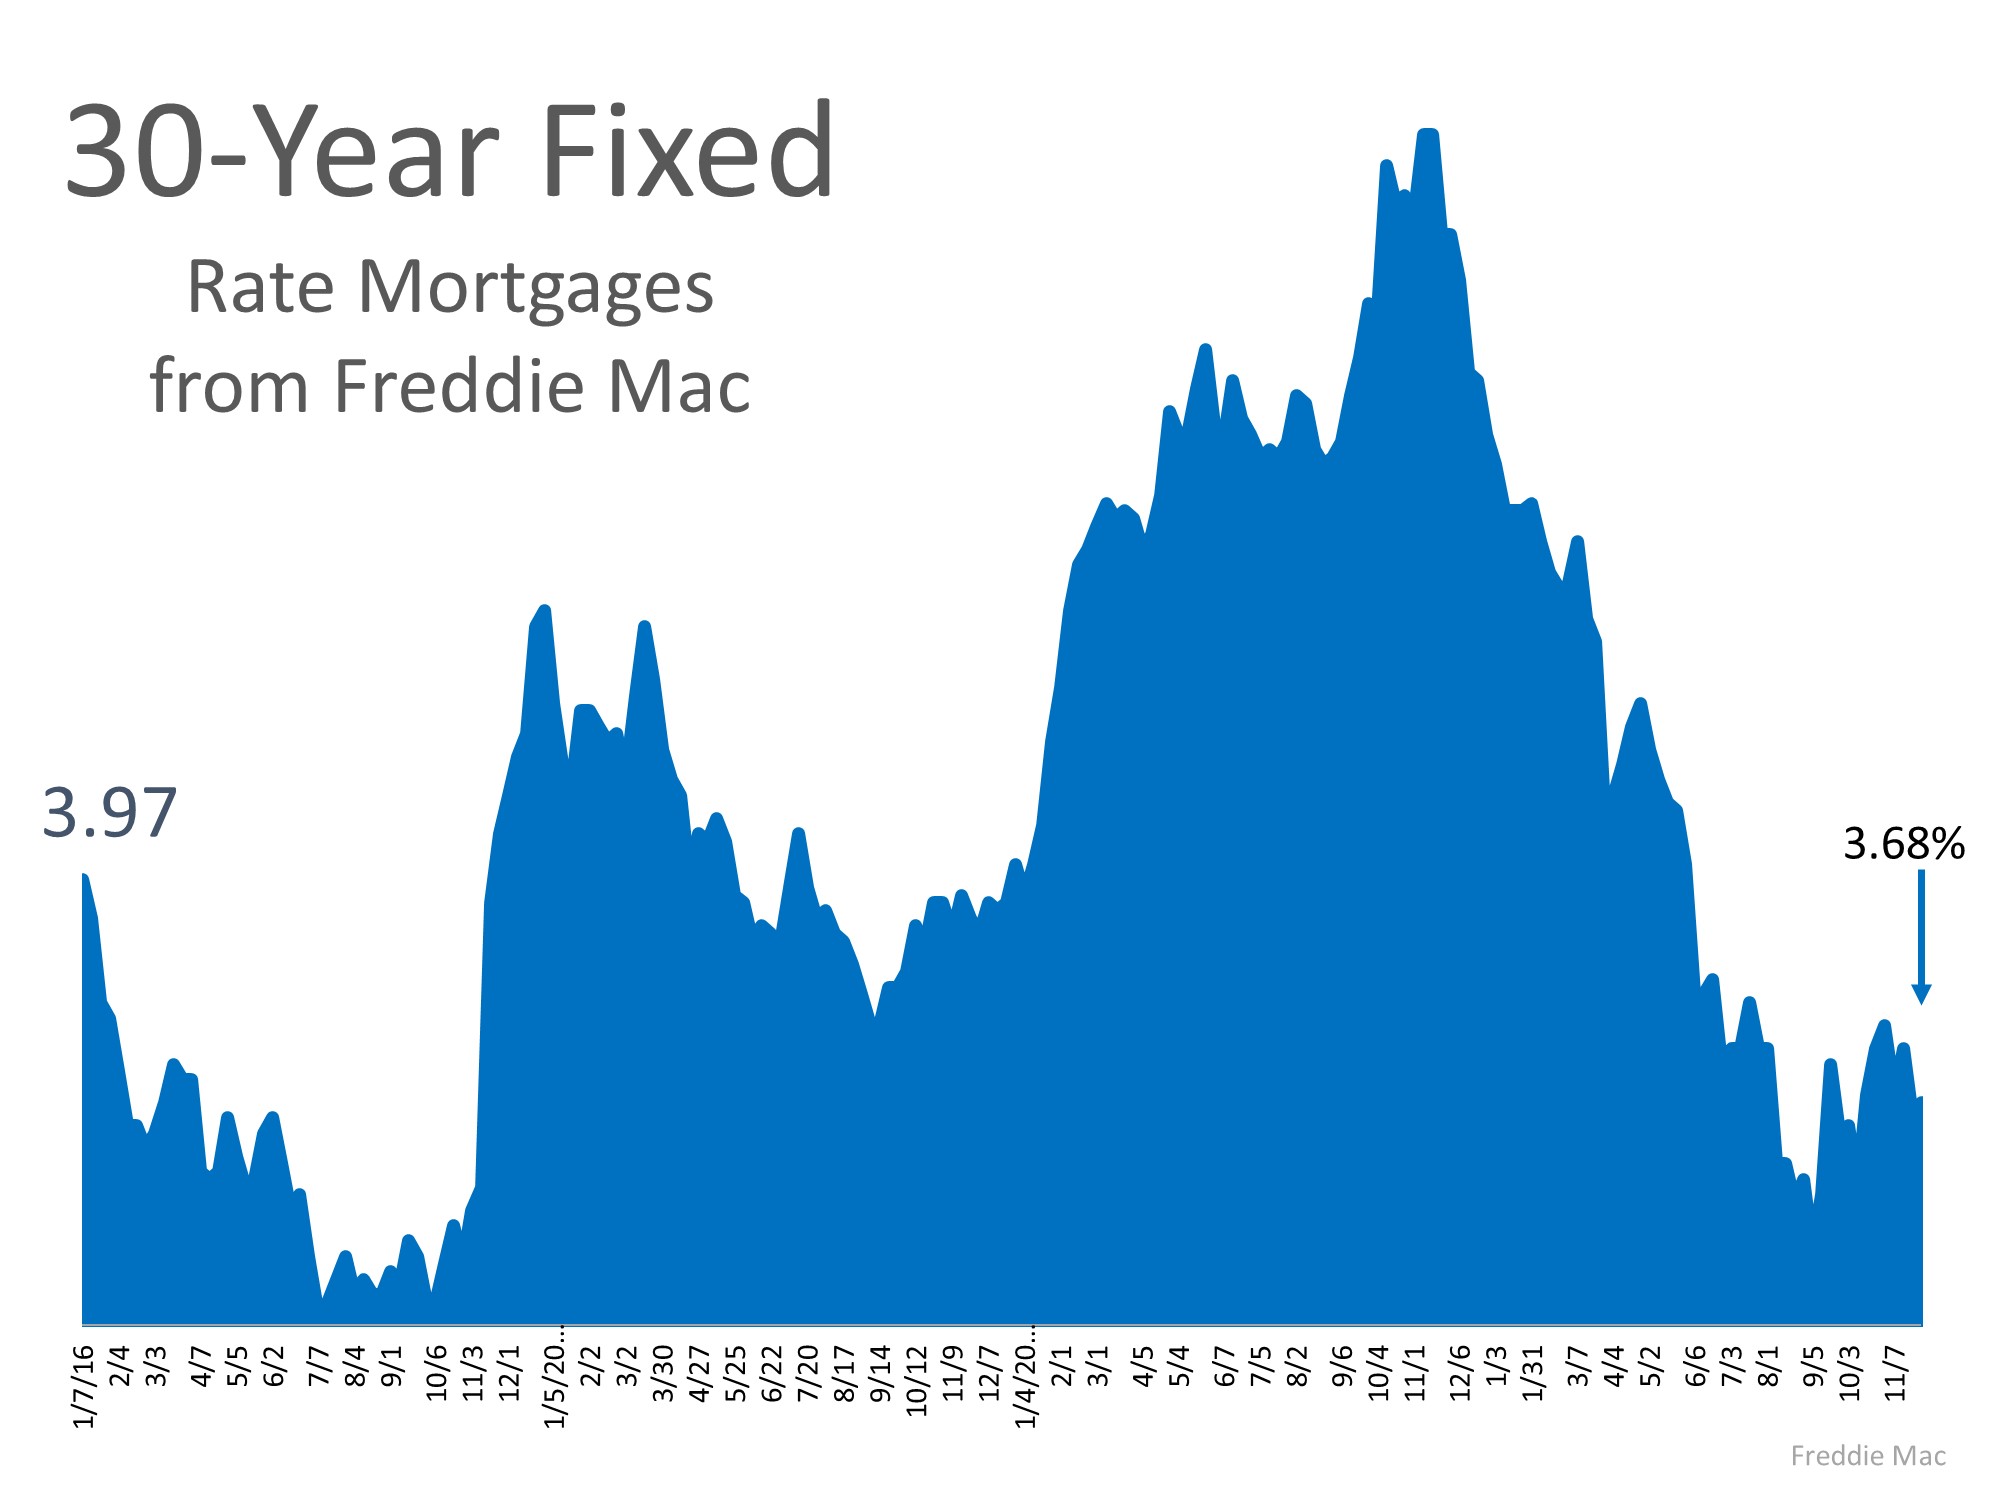
The 30 year fixed mortgage rate is still at a very low point historically, as the graph shows. Rates came down substantially from the same time last year, making homes much more affordable, since a 1% reduction in mortgage rates increases the borrowing capacity of a buyer by 10%.
Home prices grew throughout the country, and in the South we experienced a 6% year-over-year increase from 2018 to 2019. The home price forecast shows that home prices in South Carolina are expected to grow by 5.7% in 2020, compared to the 5.6% increase expected for the U.S.

This graph from Zillow shows that median rent values are rapidly rising in the United States, and this is also true for the Charleston area.
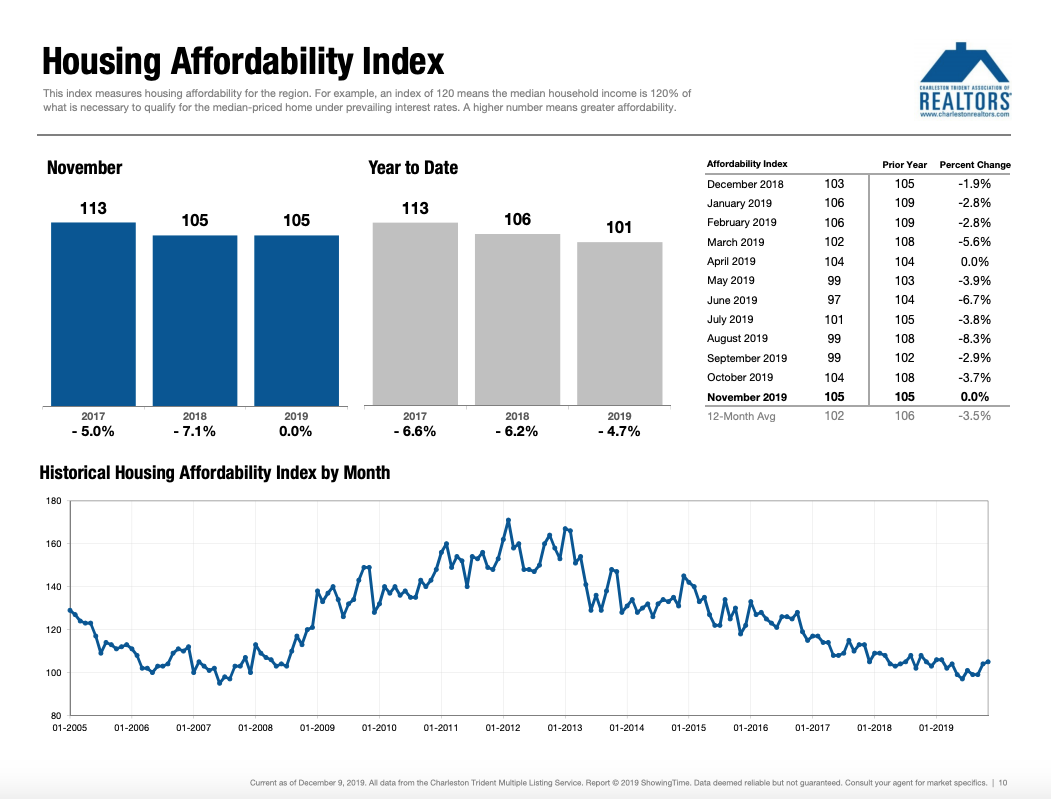
Despite the increase in the average home price, this graph shows that the home affordability index has improved for home buyers in the U.S.
Thanks to the increase in average salaries and the reduction in mortgage rates, the average mortgage payment as a percentage of income is decreasing, which makes home ownership more affordable.
Now let's switch gears and look at the Charleston Area.
The Charleston MLS Area includes 4 counties: Charleston, Berkeley, Dorchester and Colleton.
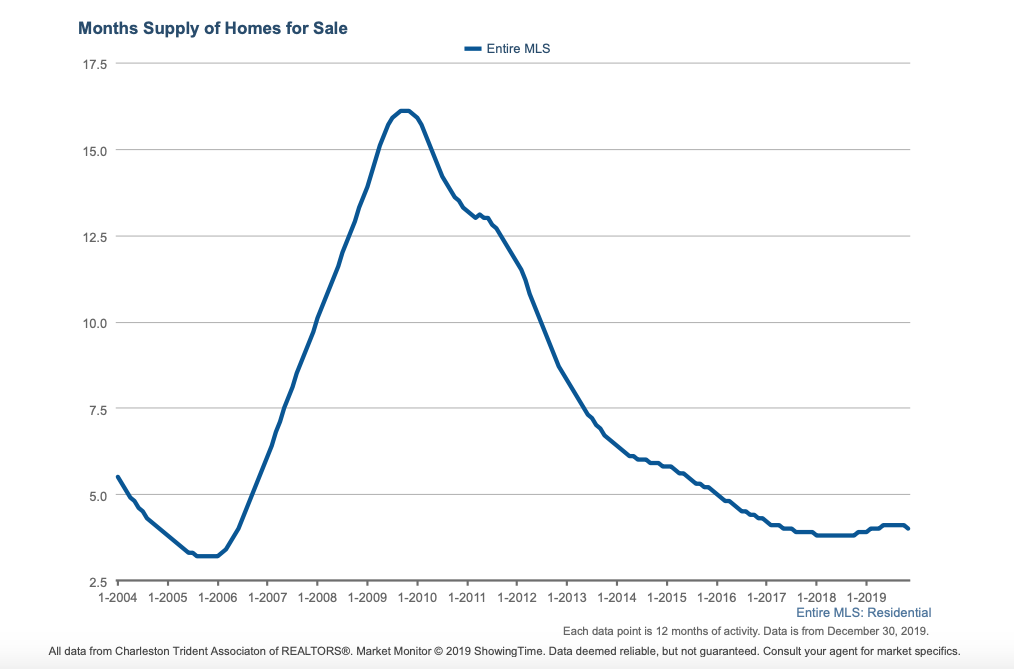
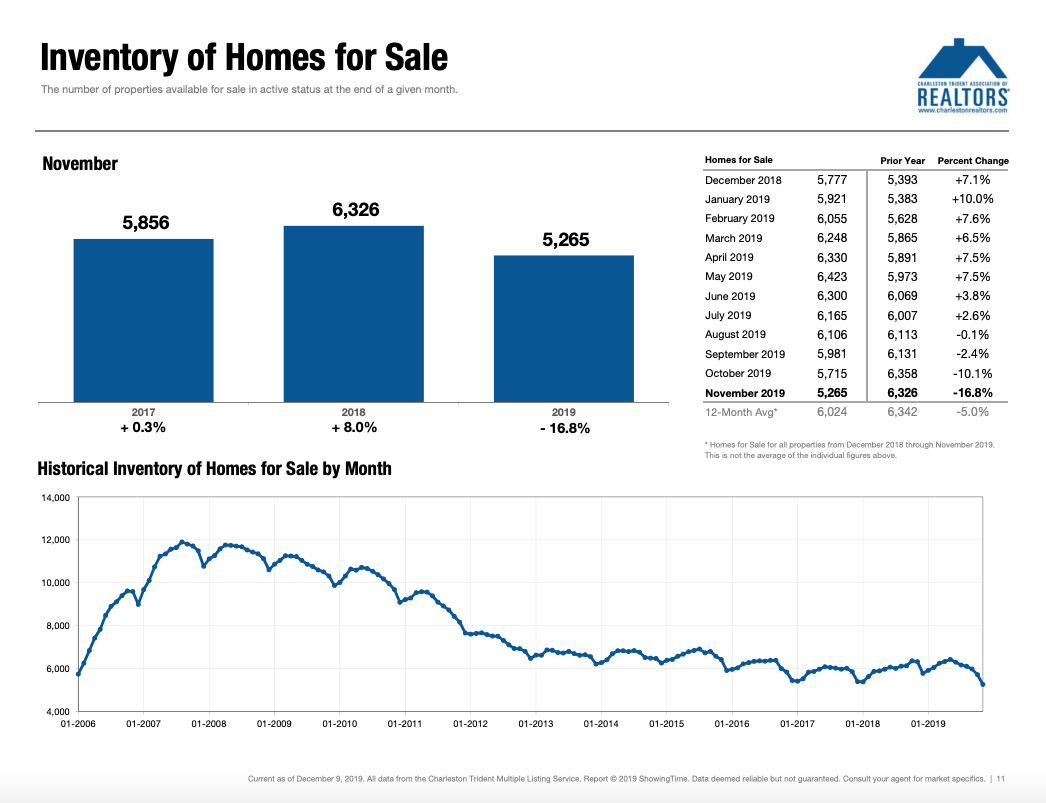
Residential real estate markets move with supply and demand. This “Months of Supply” graph shows the relationship between supply and demand of homes during the last 15 years. In real estate we refer to a 6-month supply as a “neutral” or “balanced” market, where the same number of homes come on the market as the number that sold, so inventory is stable and the market is balanced. A market with more than 6 months supply is called a “buyer's market” and below 6 months supply it is called a “seller's market” .
Right now in Charleston we are sitting at around 4 months' supply, which is clearly still an undersupplied or seller's market. There is not enough inventory of homes, and the prices are still rising.
Let's look at some of the market area highlights:
- In terms of number of homes sold, 2019 will be either the best or 2nd best year ever. As of December 27th we had closed 17,552 homes, already surpassing the number of homes sold in 2018 and rapidly closing on 2017, when a record 17,827 homes changed hands.
- Our median home price of $281,000 is also at an all-time high, but still below the median home price for the U.S. Which is $312,000.
- Demand for homes in Charleston remains strong, driven by low interest rates and population growth. The Charleston Regional Development Alliance estimates that our population has a net growth of 35 people per day in our metro area.
- But not all is rosy: Some higher-priced submarkets like Downtown Charleston, Isle of Palms and Kiawah Island are still oversupplied. For example, Kiawah Island has 20.7 months of supply and the median Days on Market for homes is 104 days.
So which are the hot areas in terms of sales activity and price increases?
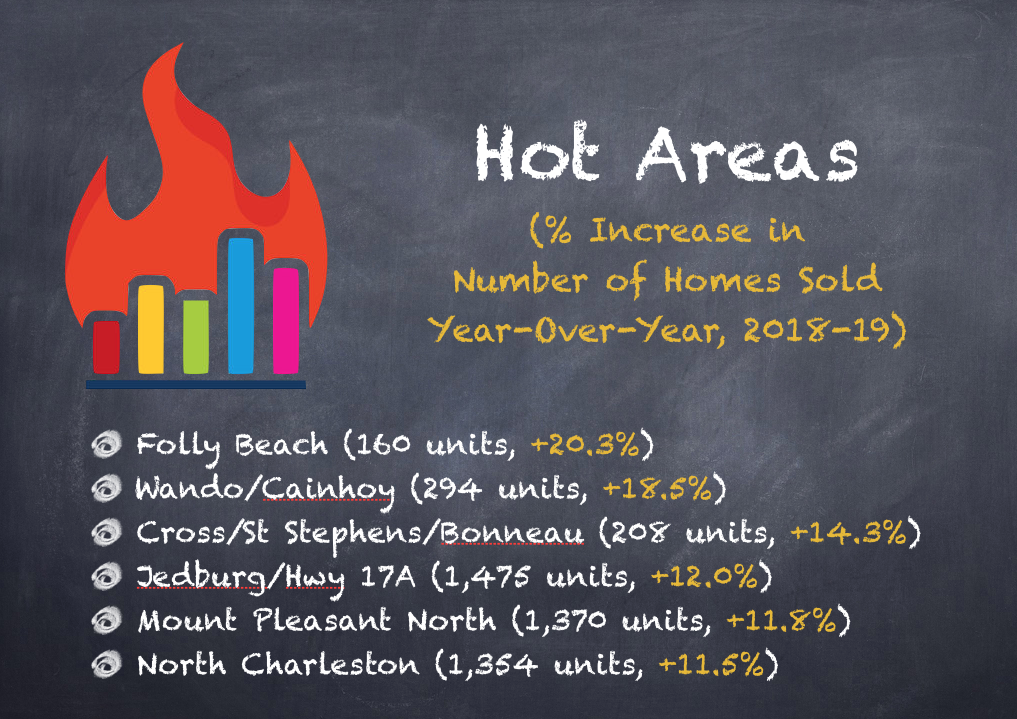
In terms of number of homes sold, the “hottest” market this year was Folly Beach, where they experienced a 20.3% increase in the number units sold. Other hot areas include Cainhoy/Wando (alongs Clements Ferry Rd.), Cross/St Stephen's/Bonneau, Jedburg, Mount Pleasant North and North Charleston.
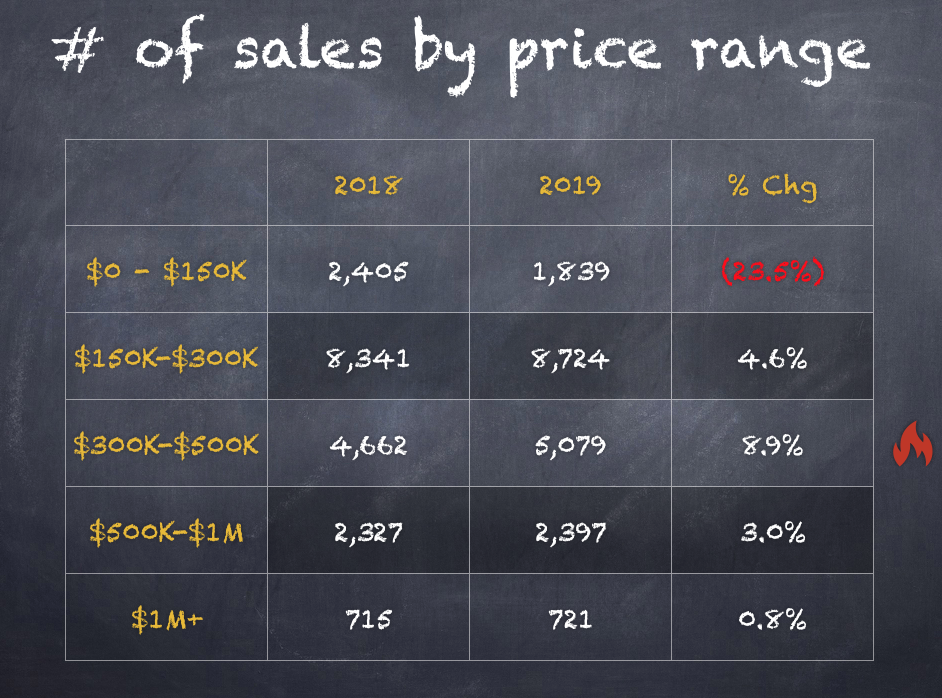
It is interesting to note that the price segment that grew the fastest during 2019 was the $300K to $500K range. It is also interesting to note that more than 700 homes over $1 million are selling per year in our area.
Which areas experienced the best appreciation?

In terms of the percentage increase in median price year over year the hot areas are Awendaw/McClellanville, Edisto Island , Wadmalaw Island, Wild Dunes and Isle of Palms.
The latter shows a market anomaly, given that The Isle of Palms market is still oversupplied, yet median prices went up!
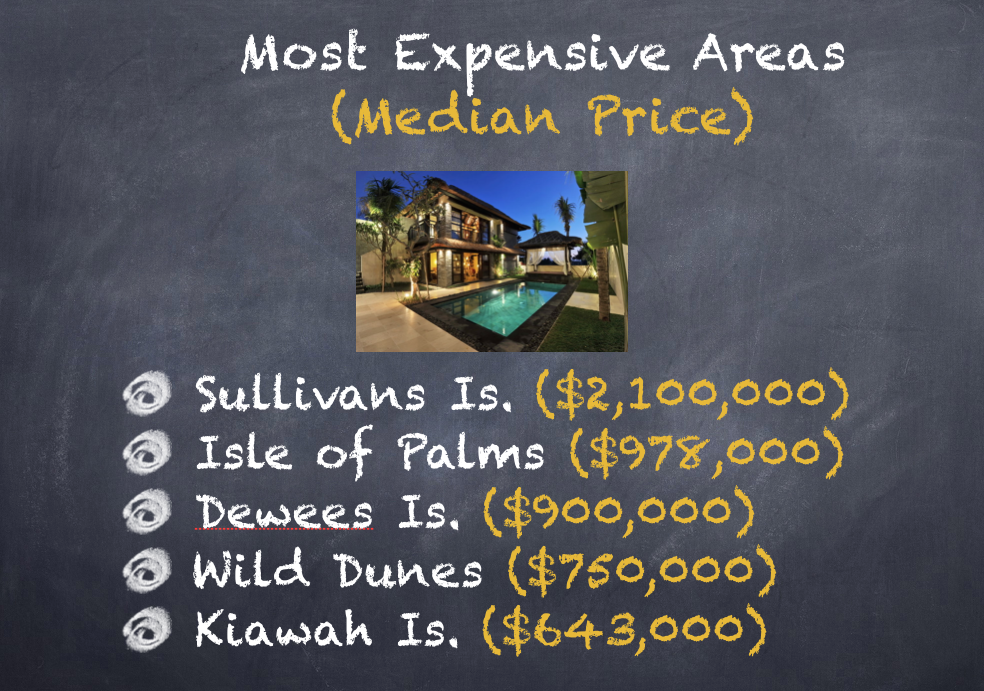
The most expensive areas in town are Sullivans Island (where the median prices 2.1 million) and Isle of Palms. Other high priced areas are Dewees Island, Wild Dunes and Kiawah island.
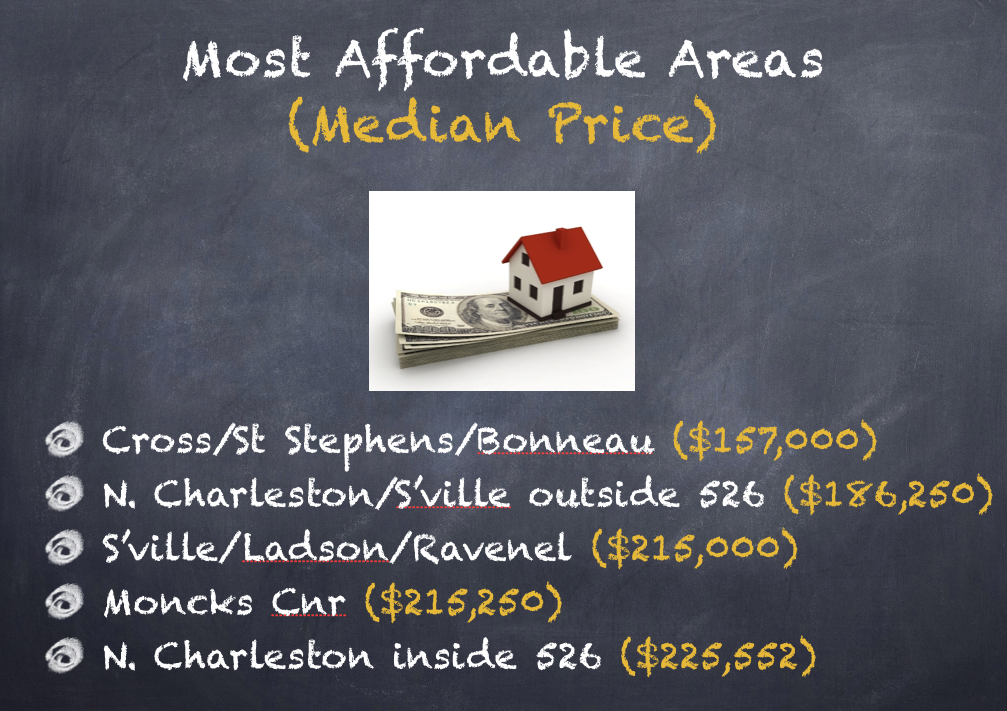
The most affordable areas include Cross/St. Stephen/Bonneau, North Charleston/Summerville outside 526, Summerville/Ladson/Ravenel, Moncks Corner and North Charleston inside 526.
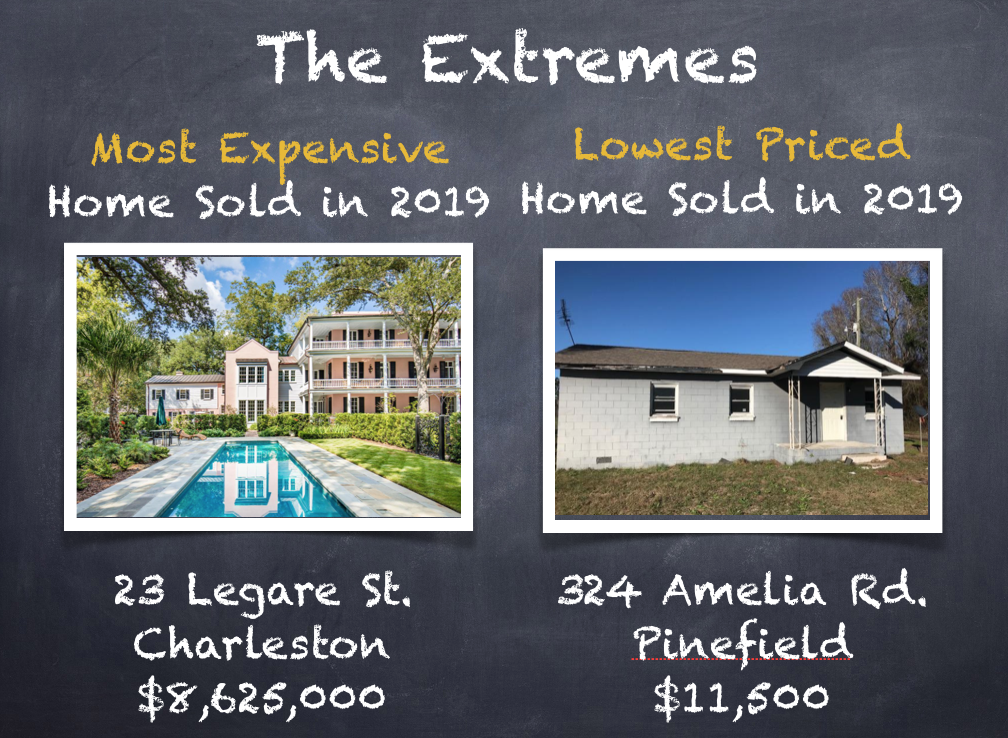
Just for fun here are the most expensive home sold this year in Charleston (23 Legare Street in Downtown Charleston sold for 8.625 million) and the cheapest home was 324 Amelia Road in Pinefield that sold for $11,500.
Lets' look at other market trends:
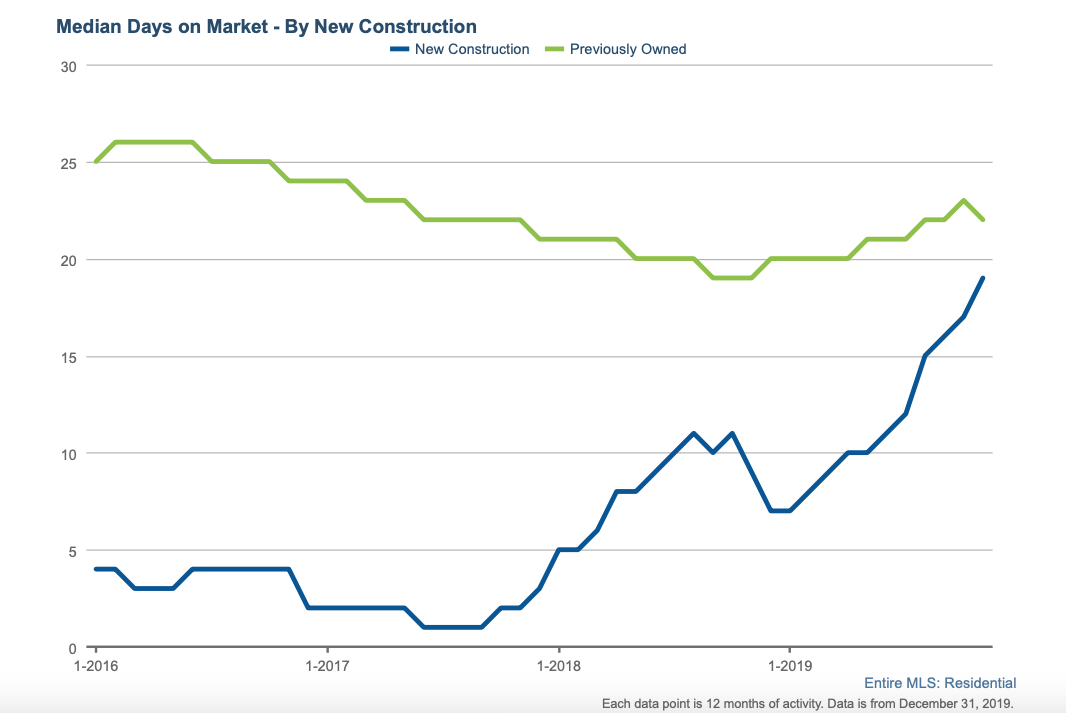
The Median Days on Market graph shows that homes are us taking a little longer to sell. You can see the curve for new construction in blue and pre-owned homes in green.
As you can see new construction homes are taking a lot longer to sell (their median days on market increased by 111.1% in the last 12 months) and pre-owned homes are also lasting a little bit longer than last year on the market share, although the gap has narrowed substantially. This could potentially drive builder holding costs higher and therefore they may “spec” fewer homes, which is good news for pre-owned home sellers.
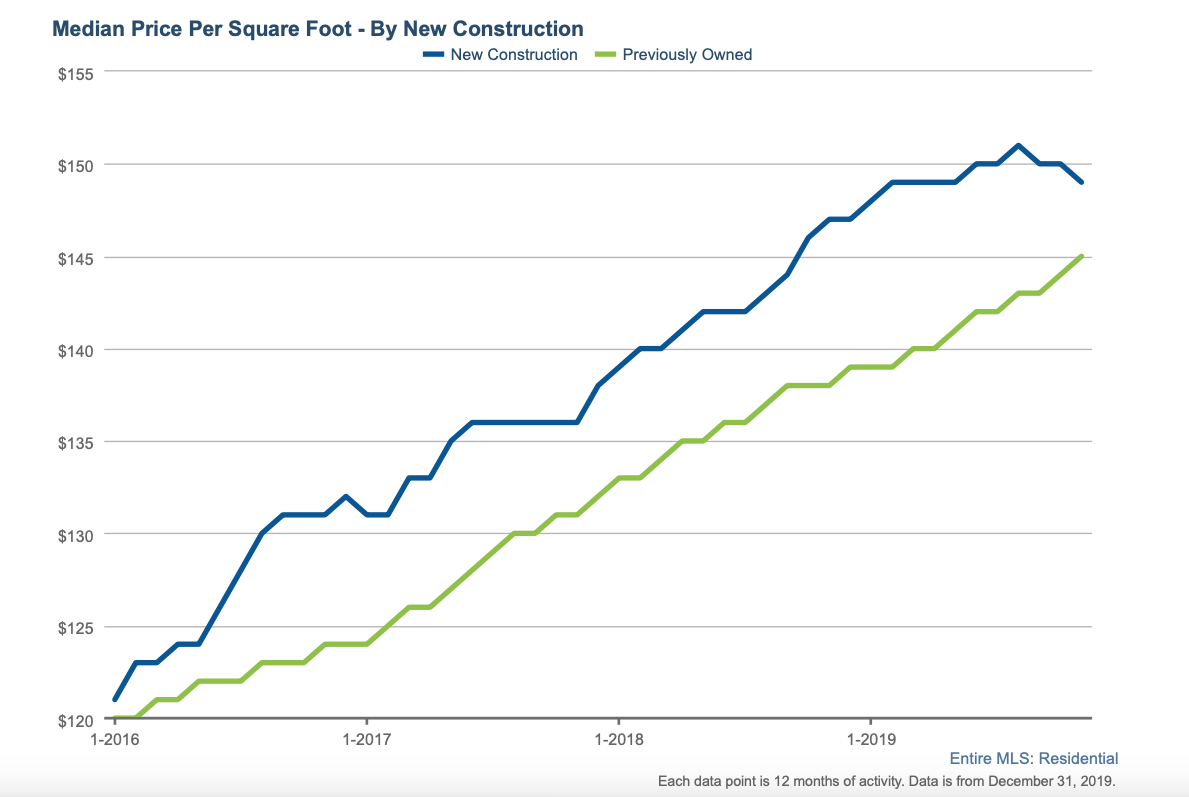
This graph shows the median price per square foot, where we can notice that the price gap has also narrowed between new and pre-owned homes in terms of prices. Builders may have experienced longer time to sell, so they have had to be less aggressive with their price increases to move their stock and compete more effectively with pre-owned homes.
Vacant land sales declined by 7.6% in 2019 but the median price remained stable.
Three market trends that we have noticed for condos and townhomes:
- The first trend is that the financing guidelines the lenders have for condos have relaxed somehow.
- The second trend is that most of the lawsuits that condo associations had against the builders have mostly been settled.
- And lastly, we have not seen many new condo developments to increase the supply (although we have seen a vast number of apartment buildings going up, and if the economy creates the conditions, many of those buildings could be converted to condos).
In the single family detached home market we have seen an abundant number of new construction projects started or re-started as in the case of Carnes, Nexton and Cane Bay in Summerville. Mount Pleasant has seen a number of small/medium infill developments. The busiest areas are Johns Island, Summerville, Goose Creek and Moncks Corner.
On the demand side, we find that generally buyers are well informed and very picky.
They compare pre-owned homes to new construction model homes so they insist on having a big price differential, and also expect a home in mint condition.
Home sellers need to be prepared to remain a little longer on the market, and must prepare their home judiciously before listing it (that means doing all the deferred maintenance, painting it, landscaping it and staging to be able to get top market price.
So what is the prognosis for the Charleston residential real estate market?
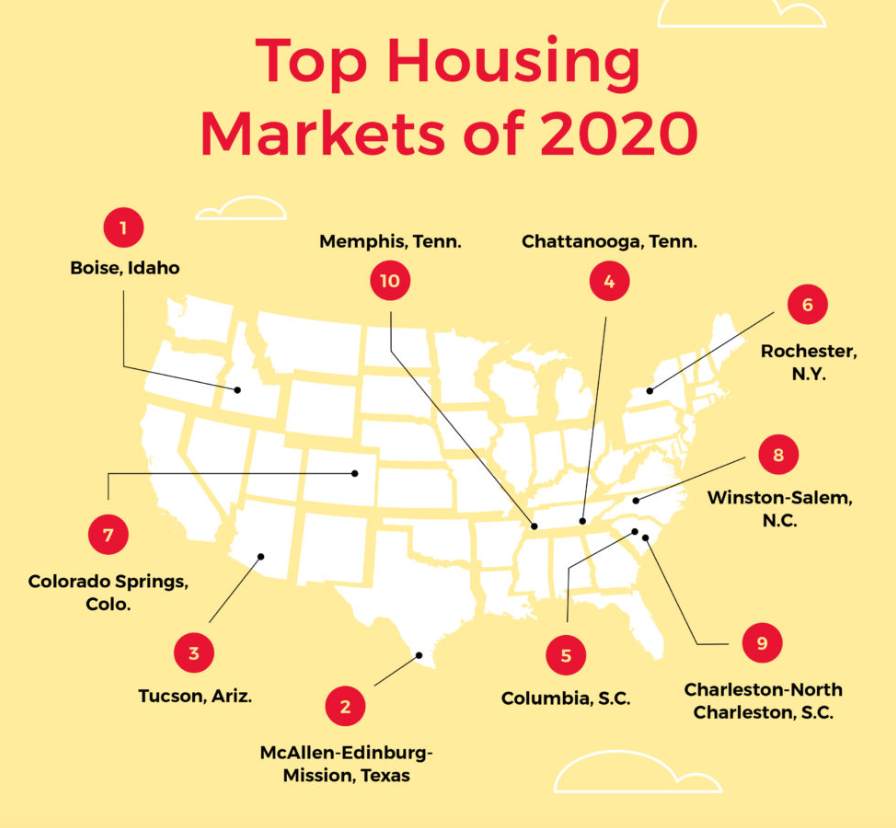
Realtor.com recently published their top housing markets for 2020 and included Charleston as one of the top housing markets for next year. We believe our population growth will remain steady, driven mostly driven by people retiring from up North and job creation driven by technology and manufacturing. Tourism, the Port of Charleston, our universities and the Joint Base will attract more people to this beautiful city and we'll keep winning prizes and accolades that will place Charleston as a crown jewel in the South East.
We may have continuing challenges with infrastructure, climate change issues and affordable housing.
In general, Charleston is a great place to live and will remain so for the foreseeable future.
Below are some market reports for the Charleston Area and some of its sub-areas.
*** PLEASE NOTE *** If you want to receive a market report for YOUR sub-area or wish to find out what homes have SOLD in YOUR NEIGHBORHOOD, please contact me via email at [email protected] with your request.