Keller Williams Realty
https://www.buyhomesincharleston.com/blog/annual-real-estate-market-update
Annual Real Estate Market Update for 2017
Posted By: Alan Donald In: Real EstateDate: Tue, Jan 23rd 2018 9:01 am
Annual Real Estate Market Update Charleston, SC - 2017 in Review
 By Alan Donald, Broker Associate
Keller Williams Realty, Mount Pleasant, SC
January, 2018
2017 Highlights
| $VOL. | #SOLD | % CHG vs. 2016 | $ MED. PRICE | % CHG vs. 2016 | % NEW CONST. |
| $5.7 Billion | 8,397 | +3.2% | $251,333 | +4.7% | 21.6% |
2017 was a record-setting year for the Charleston Area market. 18,397 properties changed hands during the year, making it the busiest year on record and beating the previous record established in 2005. Our market, similarly to the national market, has a housing inventory shortage. Sellers still hold the advantage in most sub-markets.
Our area economic indicators such as unemployment rates and consumer confidence are solid, and according to local economists, our market fundamentals are strong, and the primary economic threat is a policy error.
This does not mean that sellers can set their price and watch the offers roll in. On the contrary, buyers will be poised to test prevailing price points, particularly in markets where home price increases are outpacing wage growth and in light of the fact that mortgage rates are expected to increase further in 2018.
Note: Please click chart images to view live links.
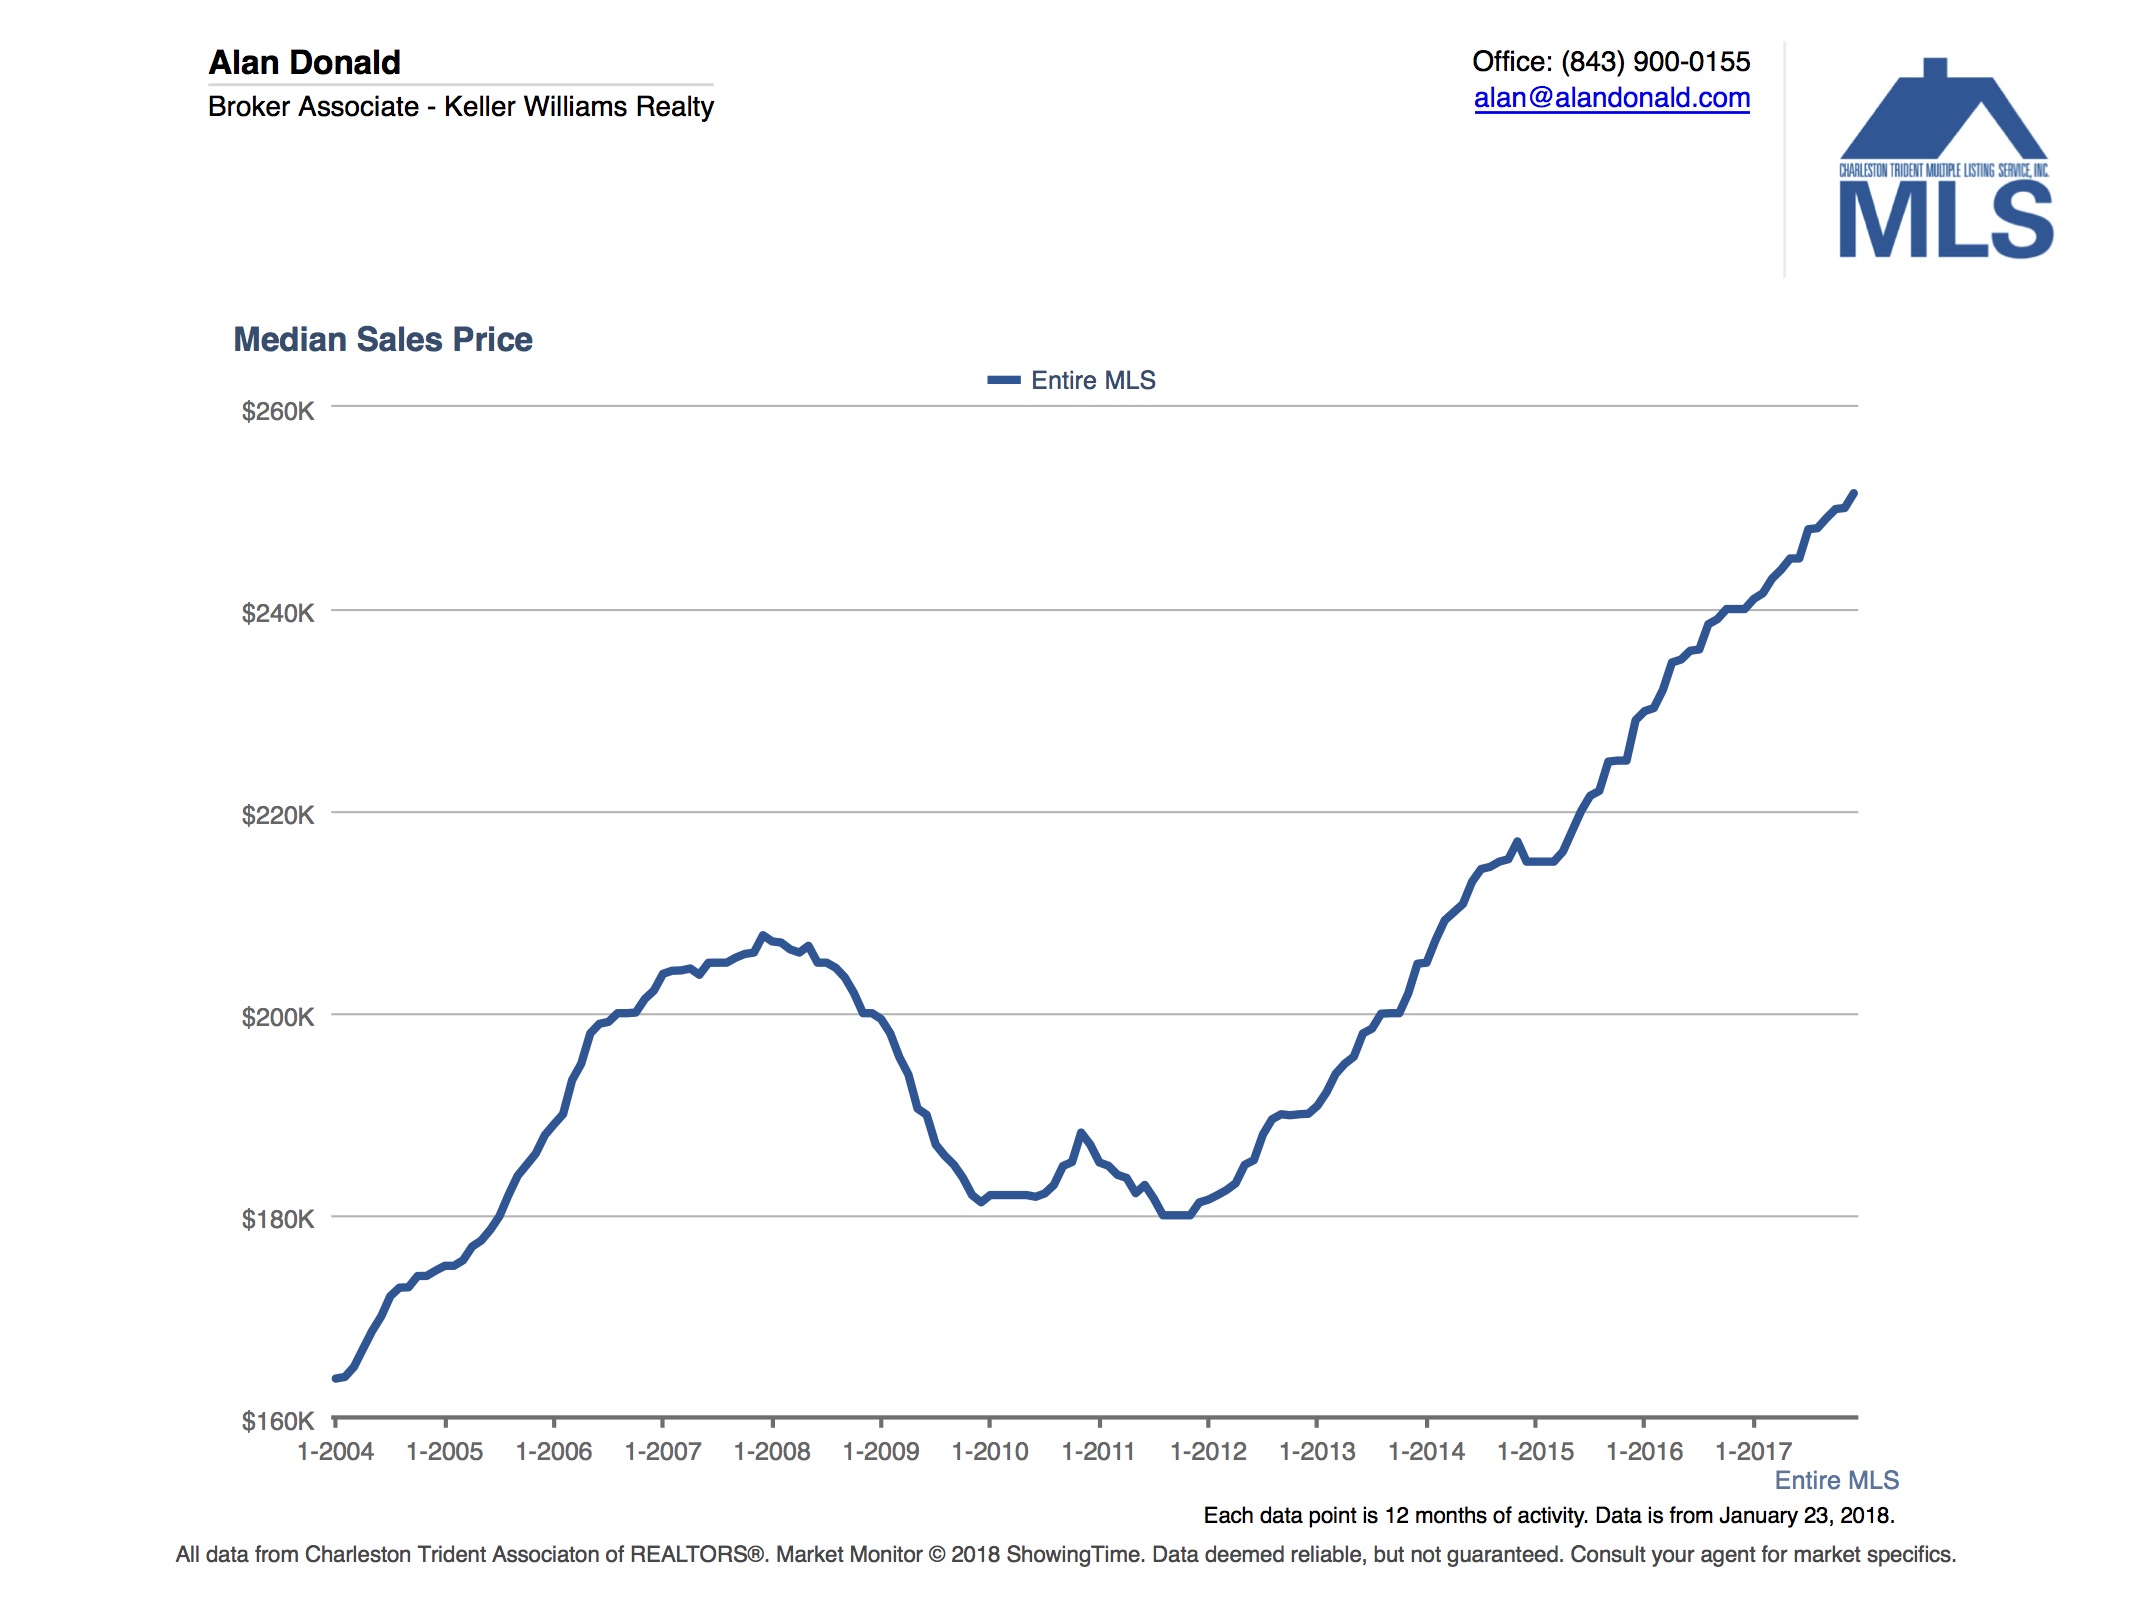
 Sales
Sales
Closed sales increased 5.4 percent to 18,397 units, up by 3.1% from 2016.
Source: 10K Market Monitor
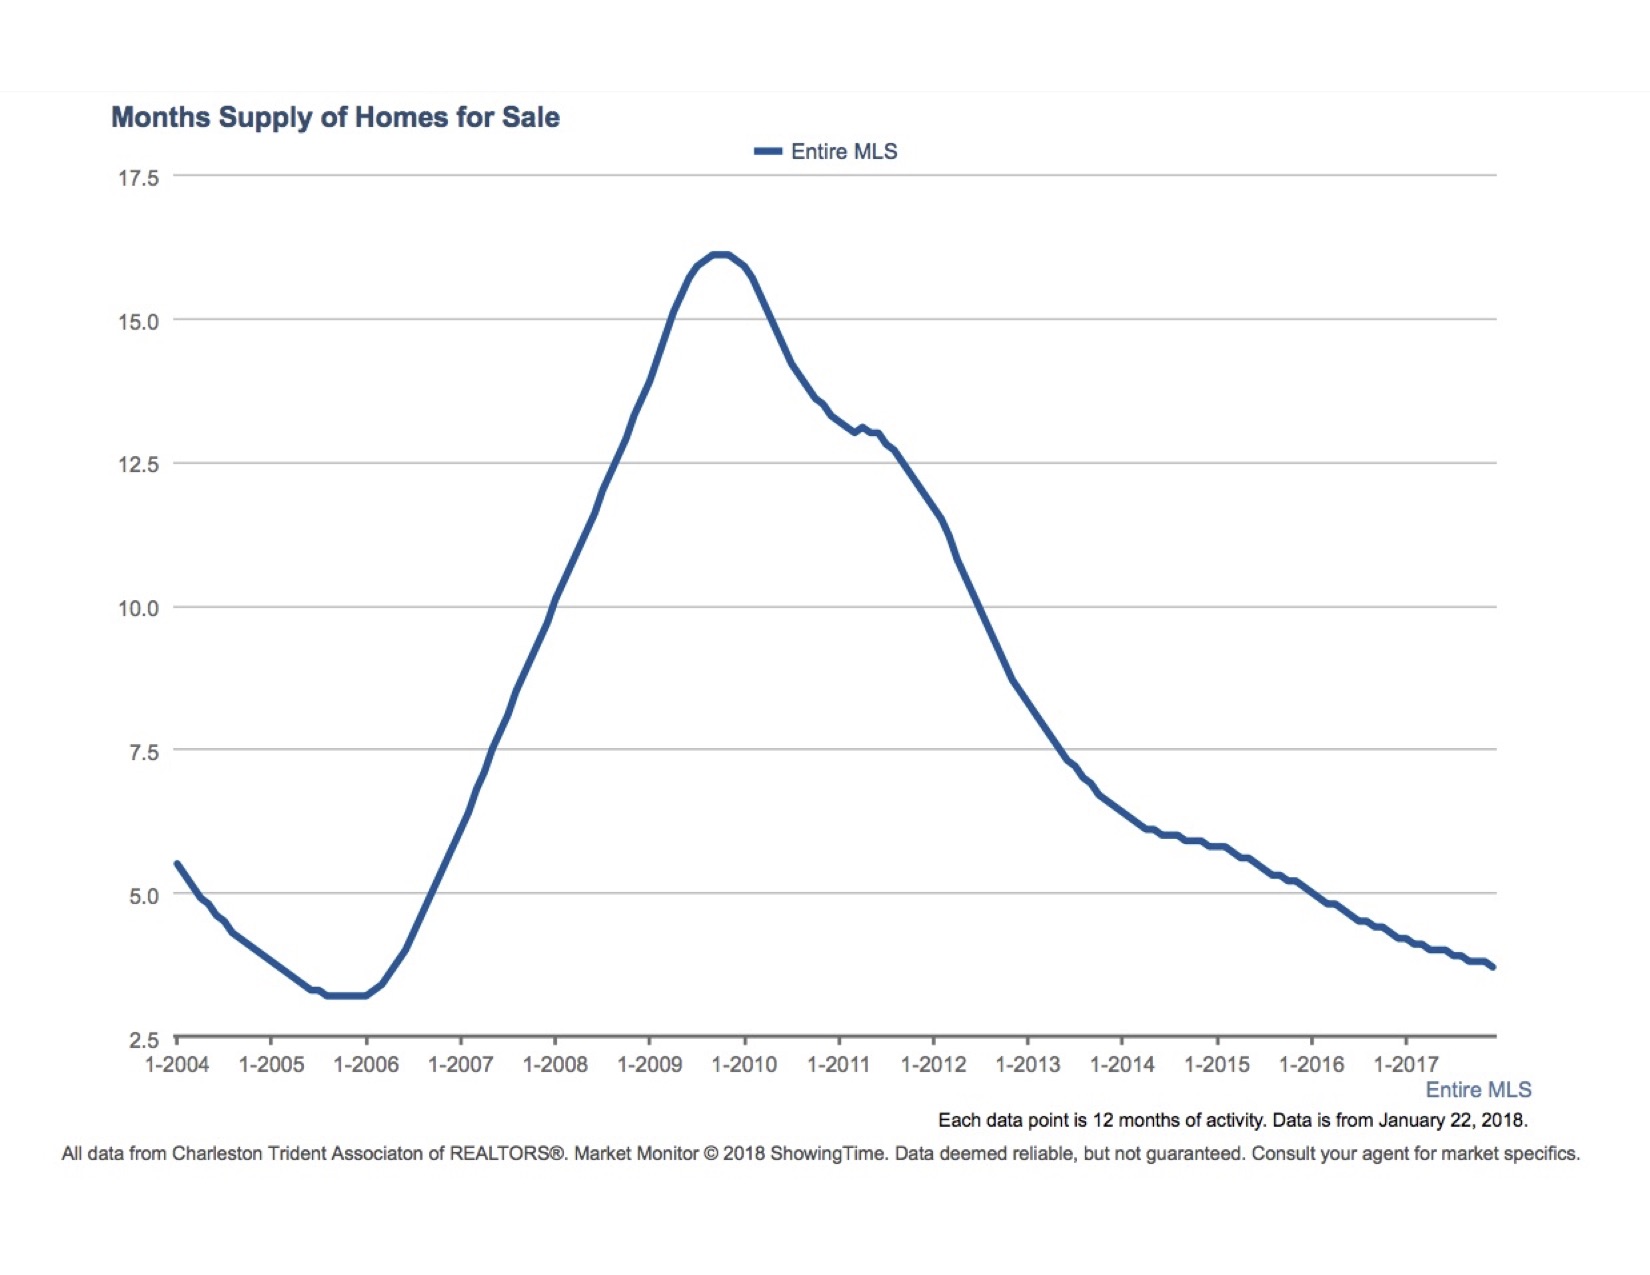
Supply
Year-over-year, the number of homes available for sale has decreased by 14%. Supply was once again lower than desired.
Showings
Homes on the market received on average, 3.2 % more showings than in 2017. The average home had 13 showings before going under contract.
Distressed Properties
The foreclosure market has dwindled down from its peak several years ago. In 2017, the percentage of closed sales that were distressed (either foreclosure or short sale) decreased by 8.1% (compared to 2016) and represented only 5.7% of the market.
New Construction
New home building numbers have increased, but not yet to a level that will help sustain a balanced market. Locally, new construction finished at 3.8 months of inventory, which still denotes a “seller” or under-supplied market. Builders are building feverishly, but they can't build fast enough because they cannot find enough skilled labor. Prices are set to increase in 2018, due in part to the shortage of labor, which should push wages up, and the increases in raw material prices after the Federal Government imposed punitive tariffs on Canadian wood products.
|
|
Home Prices Some sub-markets show large price increases (James Island, Wadmalaw, Edisto, Sullivans Island) , while others (Edisto Beach, Daniel Island) experienced price decreases! Click to enlarge. Source: 10K Market Monitor |
|
However, real estate is hyper-local, so some sub-markets are doing better than others. The next table shows the price changes by MLS Market Area (click to enlarge). Source: Charleston Real Estate Stats |
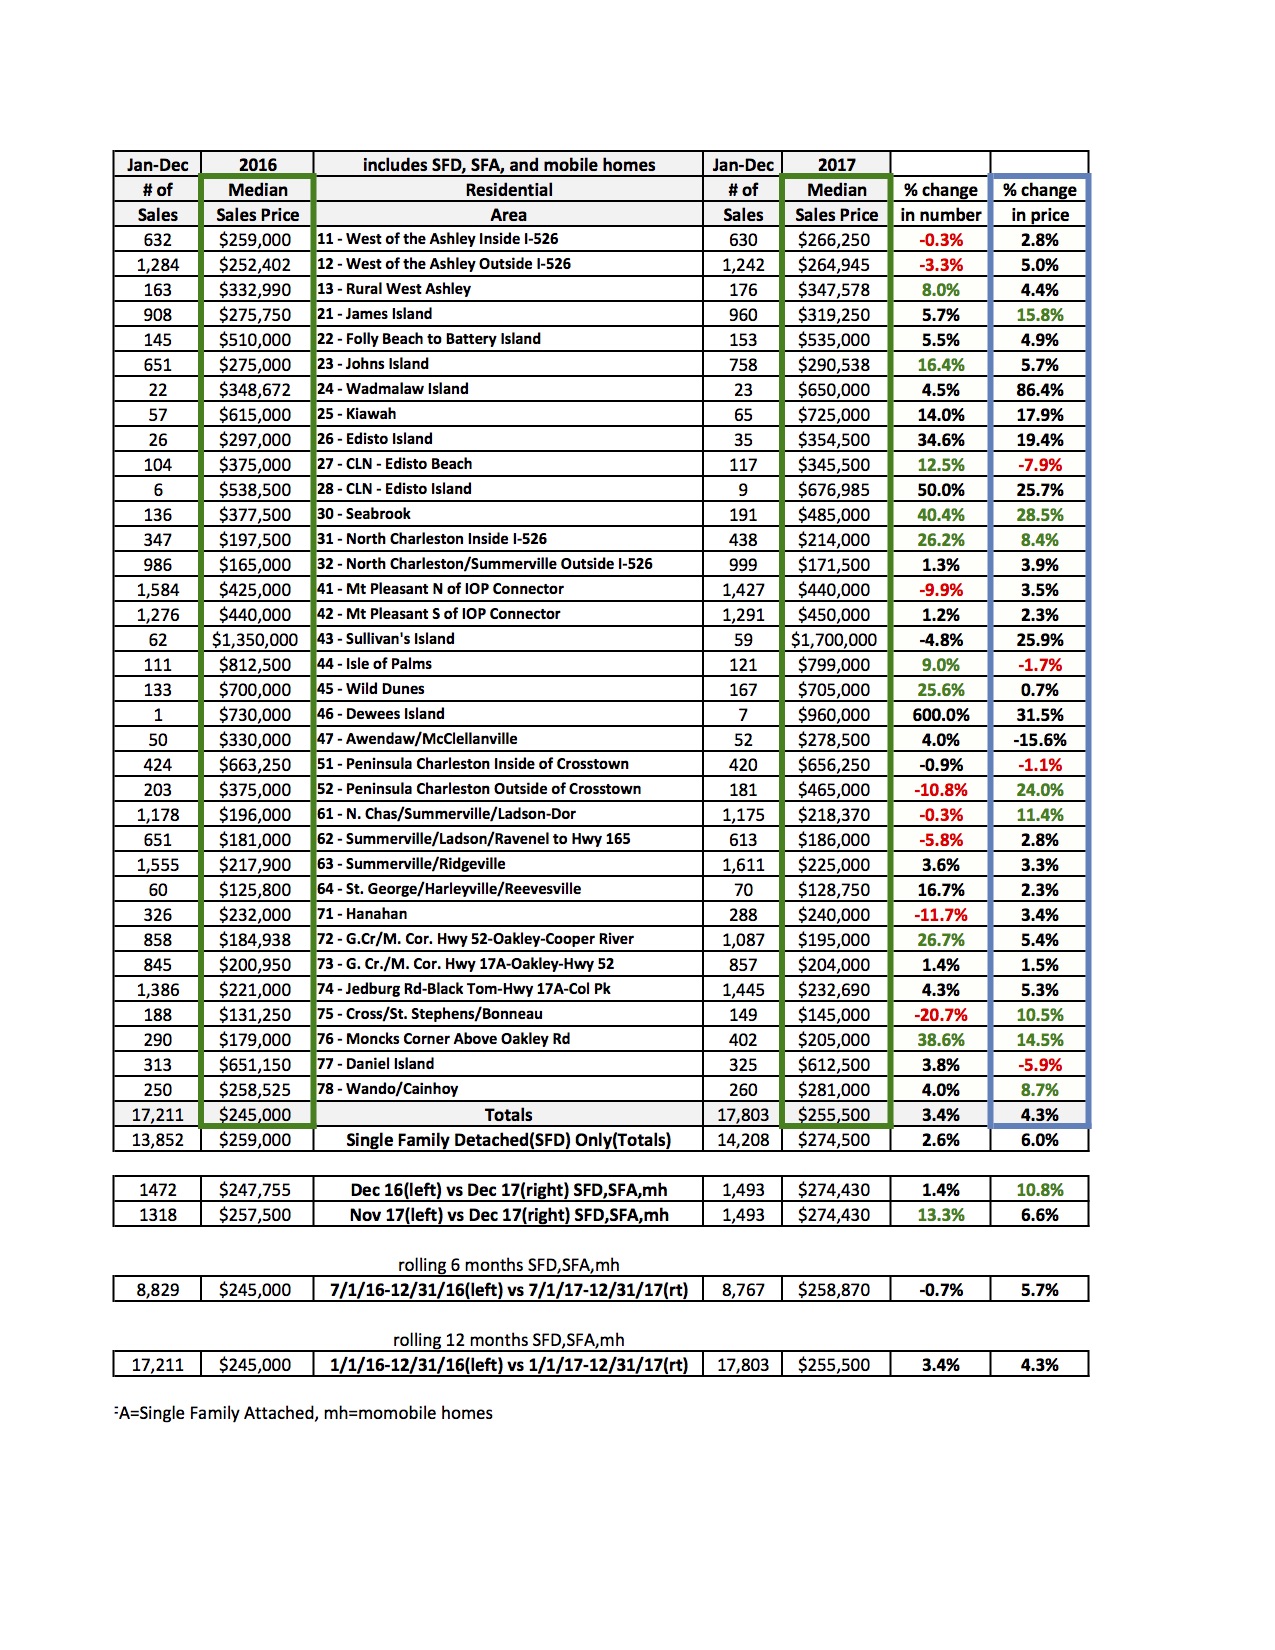 |
Some of the larger price increases are for island properties (Wadmalaw, Edisto, Seabrook, Dewees) and this is because those markets had fallen behind and “lagged” activity in years past, so they are “catching up” with the rest of the area.
|
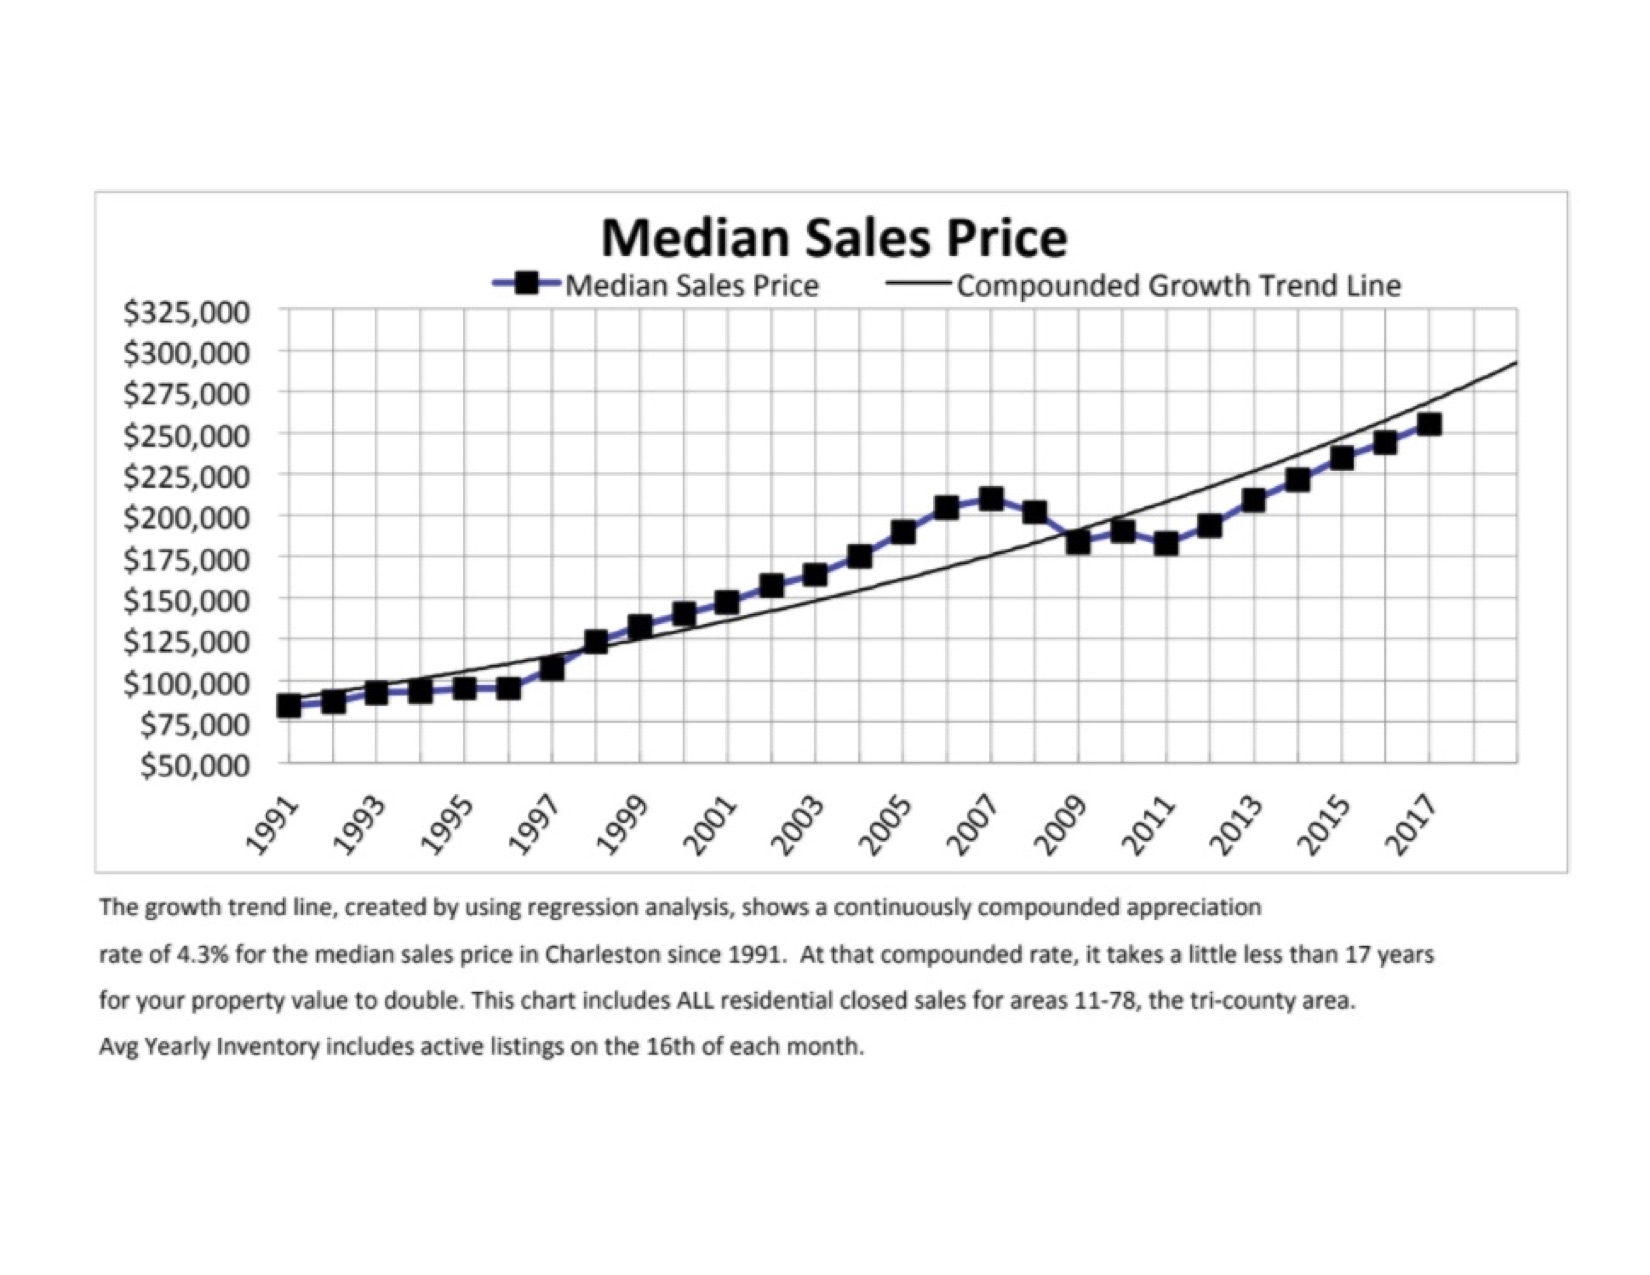
Have Prices Peaked? This line can be projected forward into the future to predict where we should be, based on the past. What is important for us is that we are still below the trend line. This means that we may still be undervalued and have additional room for appreciation, which minimizes the risk of a “bubble” like the one we experienced in 2006. Source: Charleston Real Estate Stats |
|
|
Supply and Demand Source: 10K Market Monitor |
 |
|
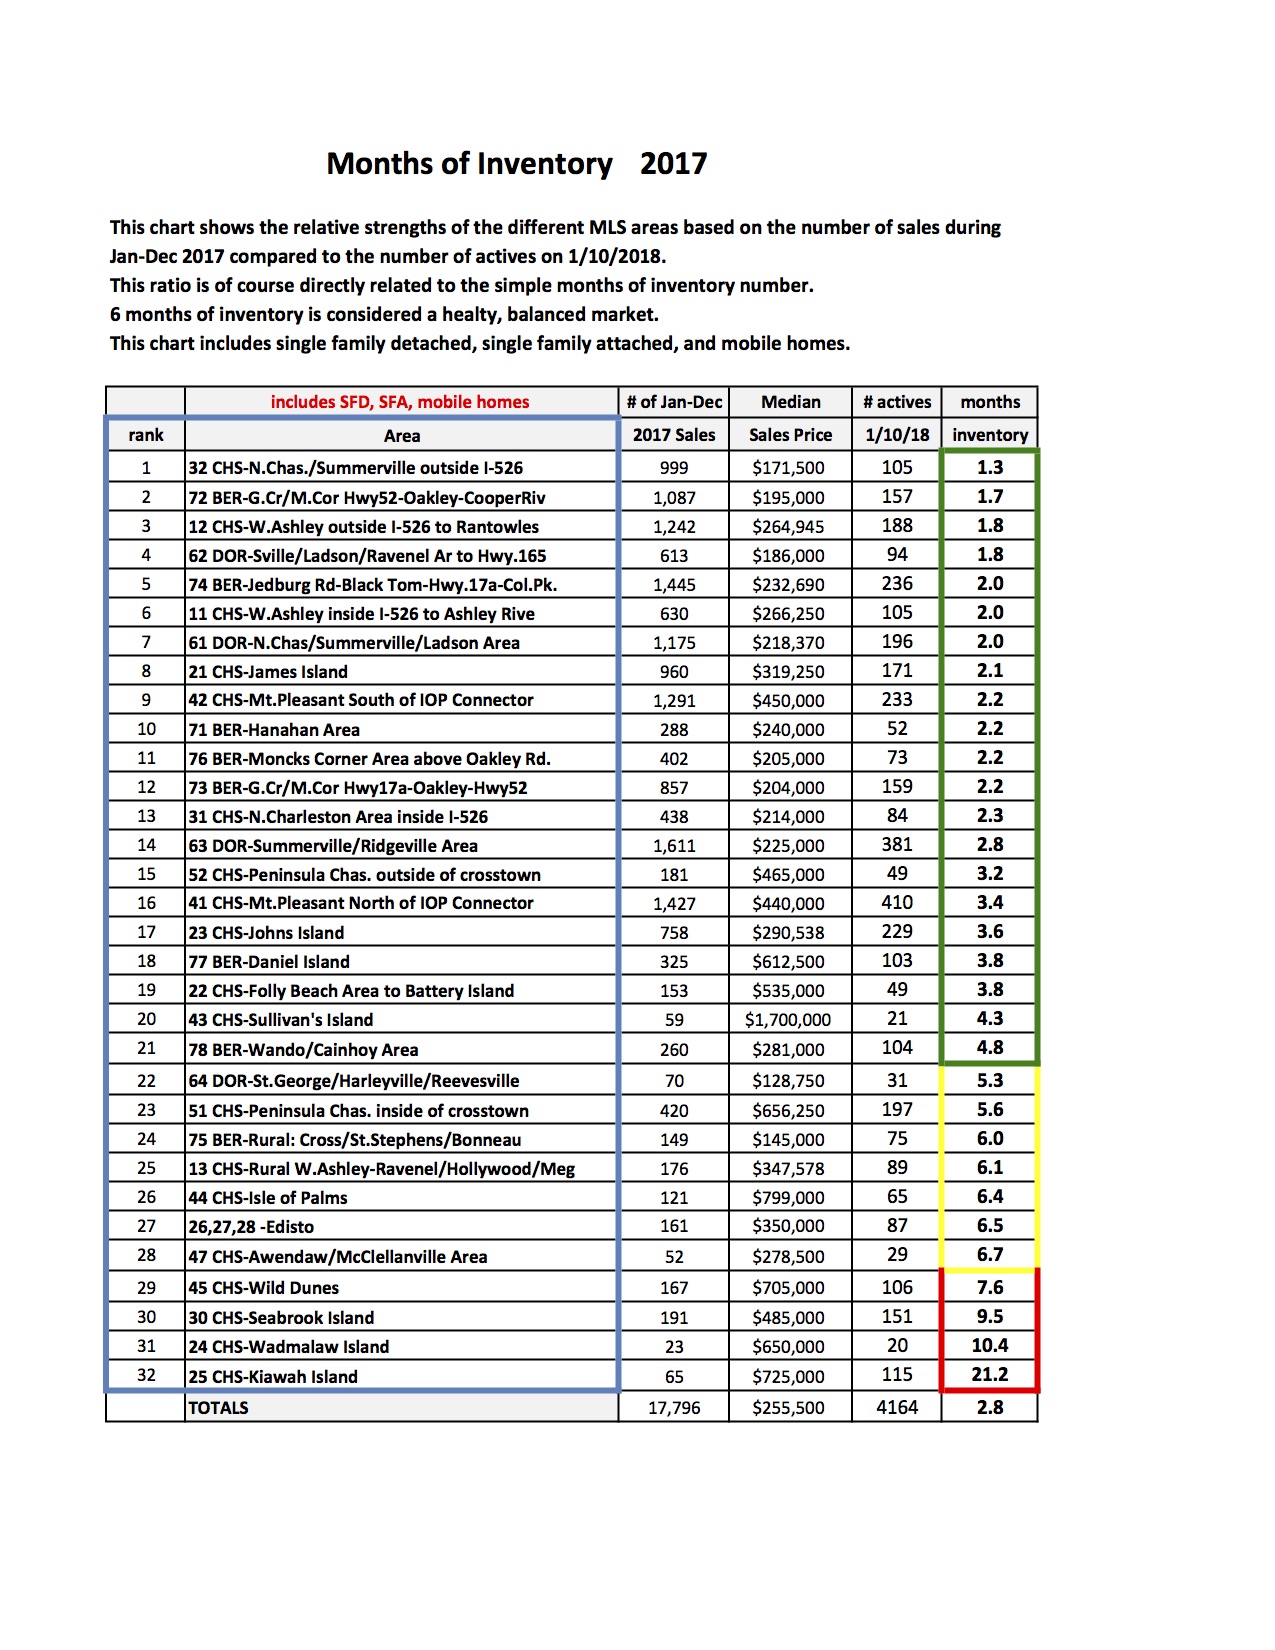
Are We Still in a "Seller's Market"? The ratio between supply and demand varies by MLS area (click to enlarge). Currently the “hottest” markets are in “lower priced” areas like Summerville, Goose Creek and Ladson. Source: Charleston Real Estate Stats |
 |
Prognosis for 2018
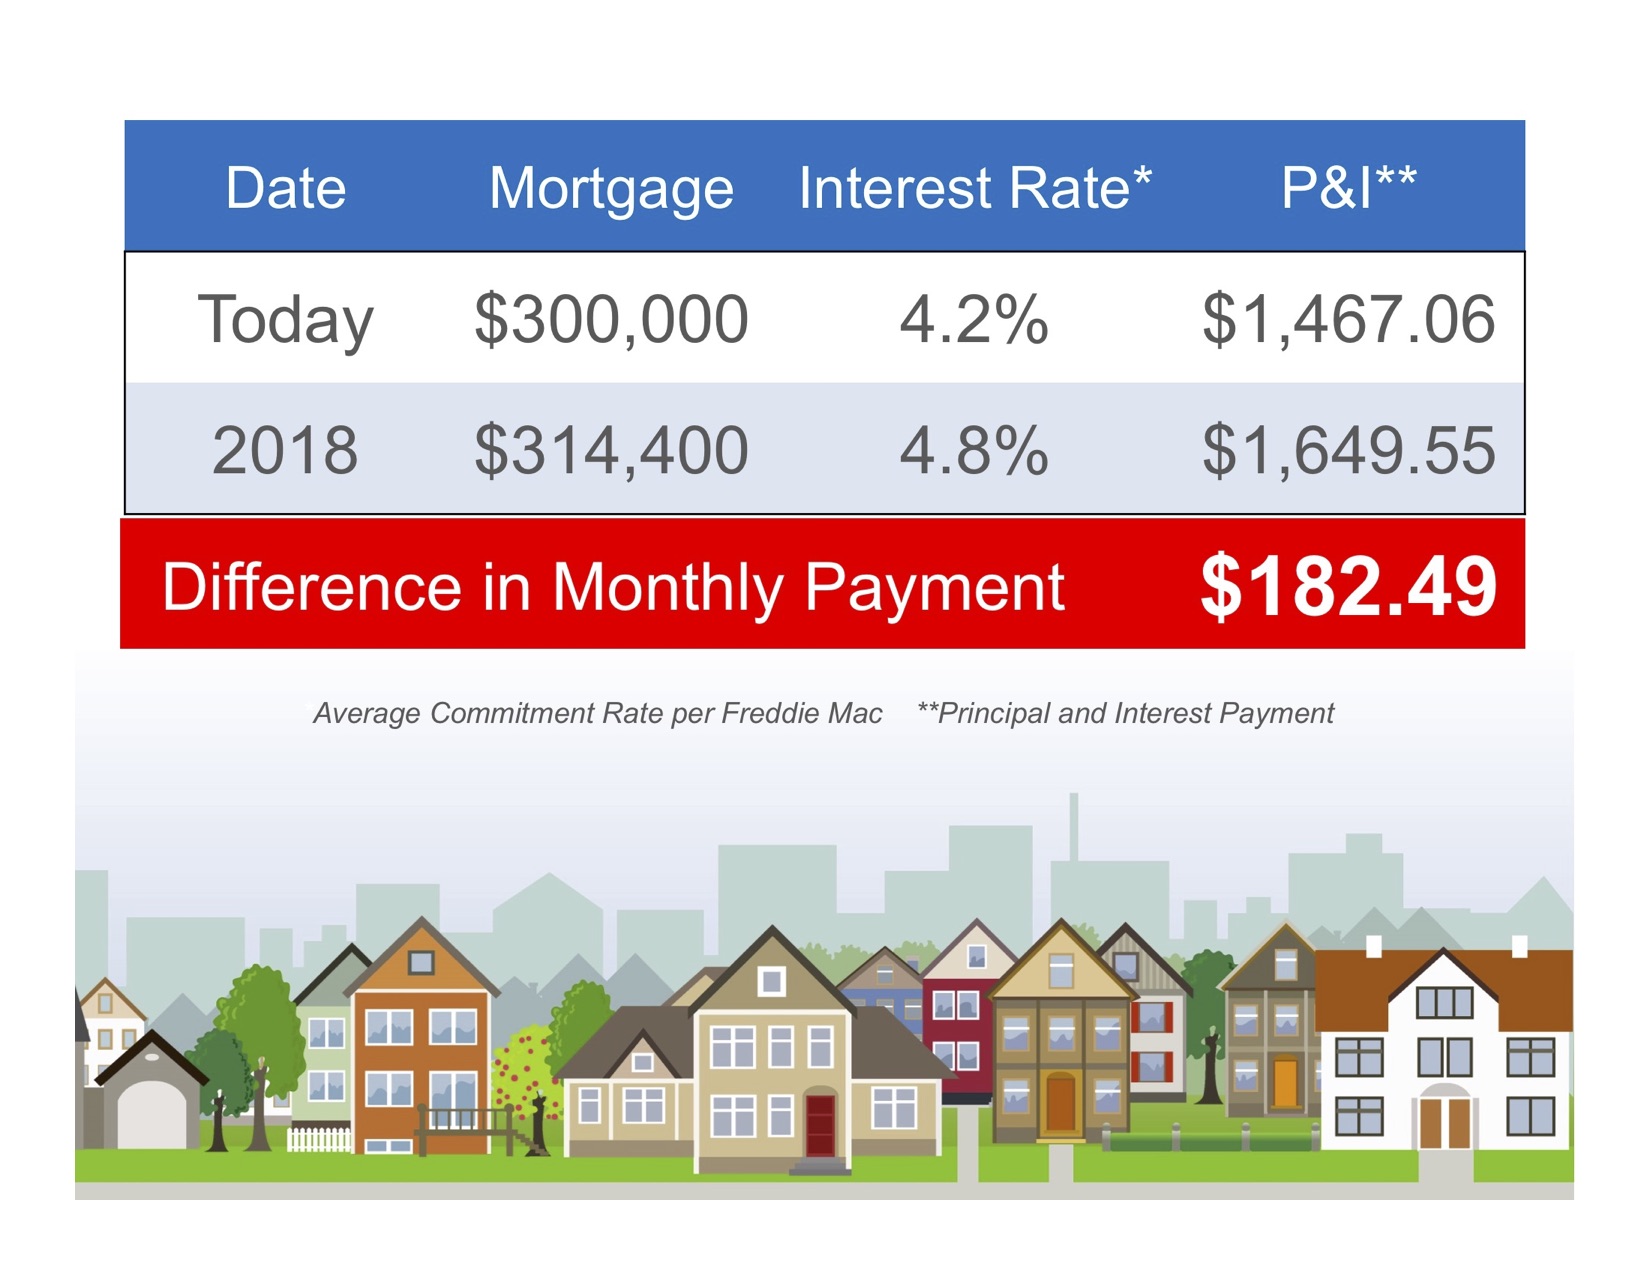
The Tax Reforms passed by Congress in late 2017 will have varying effects across the nation. High-priced coastal markets may feel the changes more than the middle of the country, given the higher price points. And some potential buyers may see the changes as providing less of an investment benefit for homeowners. On the other hand, the limit on Property and State Tax deductions may benefit states with lower property taxes, like South Carolina. The National Association of Realtors has adjusted their forecast to incorporate the effect of the new Tax Code (see illustration below).

Source: KCM
For those who have their minds made up to buy a home in 2018, it will likely still be a competitive ride, especially in the lower price points. The trend has widely been toward fewer days on market and fewer months of supply, indicating strong demand despite higher prices and low inventory. This could prove tricky for first-time home buyers, although on the lending side we have seen some relaxation, with 100% loan programs becoming available again for certain segments.
In the luxury market (above $500,000), we expect further softening, longer Days on Market, and more showings per listing prior to going under contract.
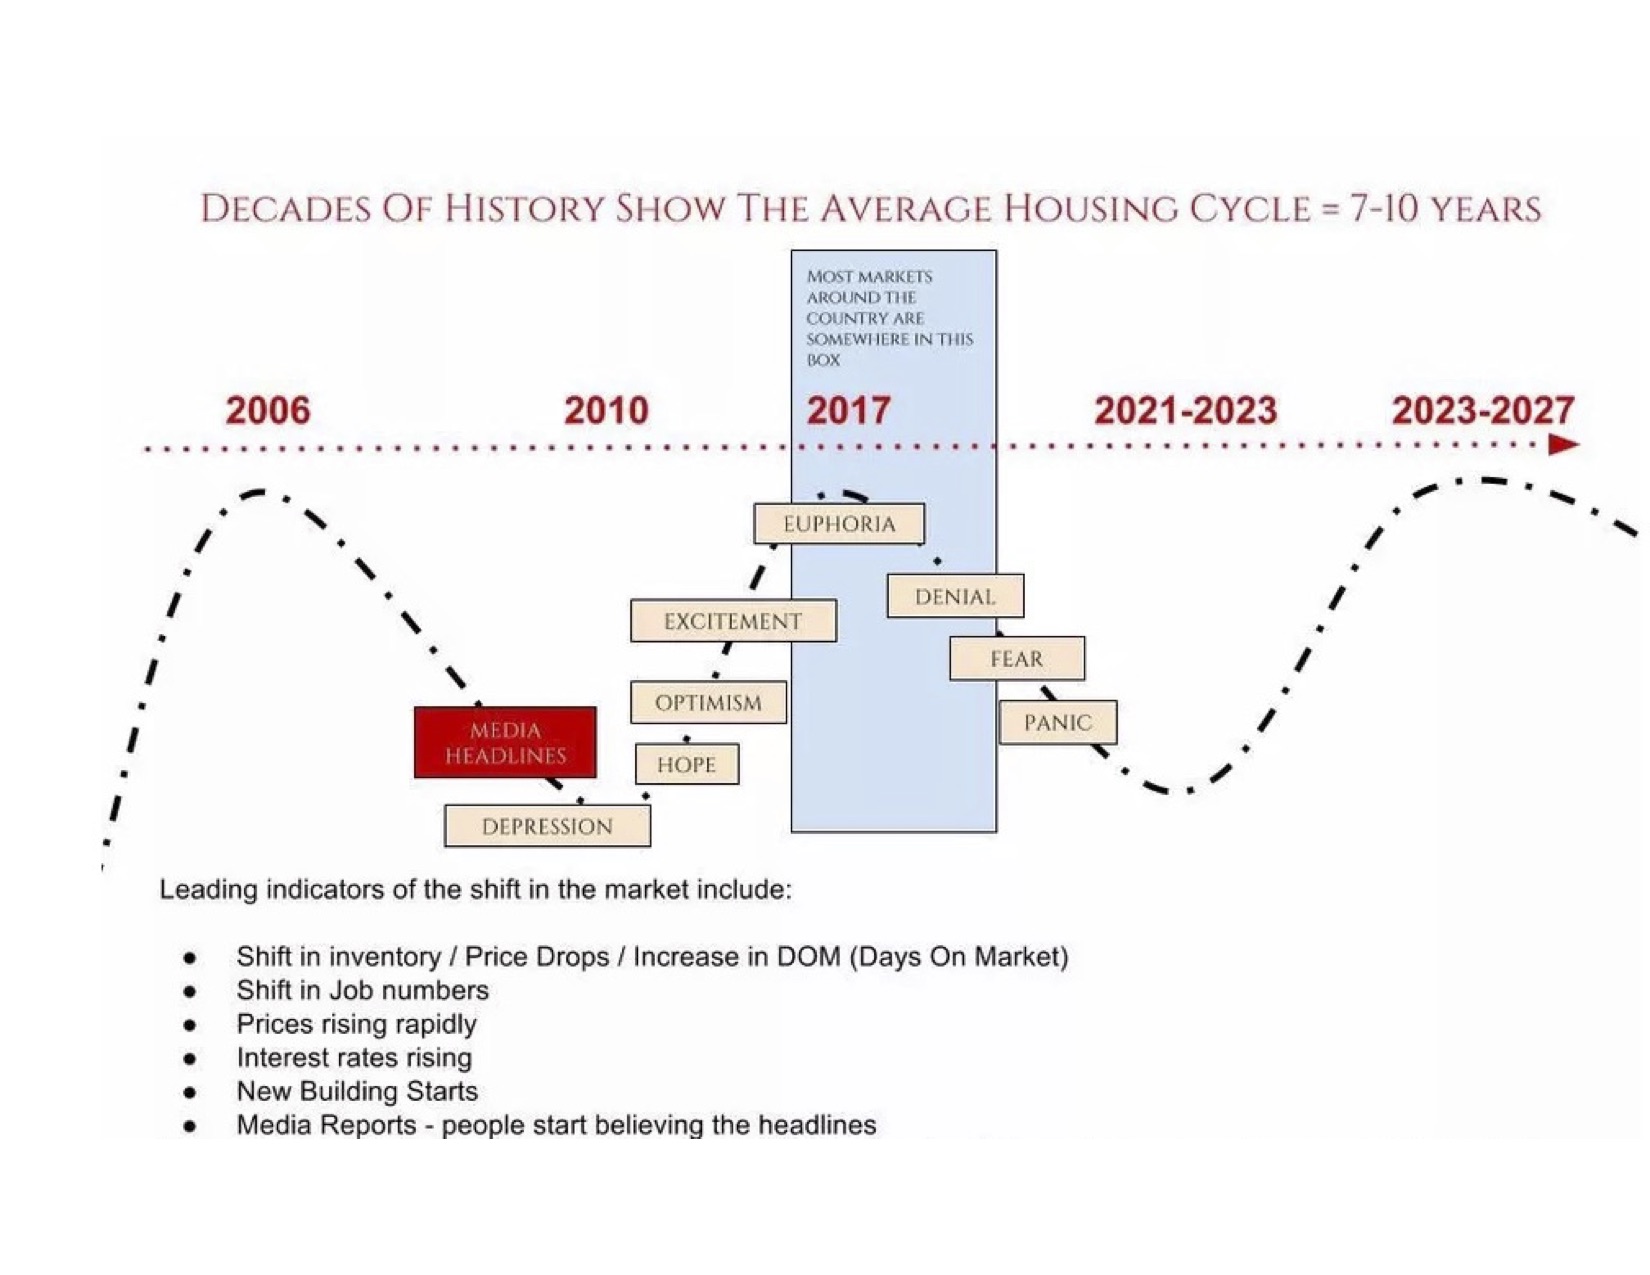 |
The Real Estate Cycle Those of us who have been in the business for more than 10 years understand that the real estate is a cyclical market, and the full cycle lasts 7-10 years. Sometimes the real estate cycle is in sync with the economic cycle, but other times it is driven by its own dynamics. If we follow trends, we are overdue for a market shift. Perhaps the severity of the past recessionary cycle has created a longer time interval this time around. With technology and improved connectivity, the media plays an important role in exacerbating these trends. The illustration shows the typical market cycle and corresponding media headline sentiments. Market shifts happen first gradually, then suddenly, so by the time the media starts talking about a shift, we will already be in it. Predicting the timing of a market shift is challenging at best, everything we see seems to indicate we will have a market shift in 2018 or 2019, despite the strength of the economy. Graph Source: Rowena Patton, Keller Williams
|
A few of the higher priced markets in the nation are already showing signs of a shift at the top of the market (luxury homes in L.A., New York, Miami) which is where the trend starts and then expands to the rest of the market. In the Charleston Area, higher priced markets like Daniel Island and some segments in Mount Pleasant are already feeling this Despite our solid economic fundamentals, it is likely that the Charleston market follows a national correction trend closely.
|
First Time Home Buyers Source: KCM |
 |
|
Pricing Your Home in a Shifting Market Enter the APC, our proprietary pricing model that uses statistical regression analysis to produce a price range that will eliminate the subjectivity of the adjustments and give you a much higher level of confidence than the traditional CMA. |
 |
For a FREE APC Regression-Based Market Value Estimate for your home, please click here.
Or call/text us on 843-900-0155